Posted on Leave a comment

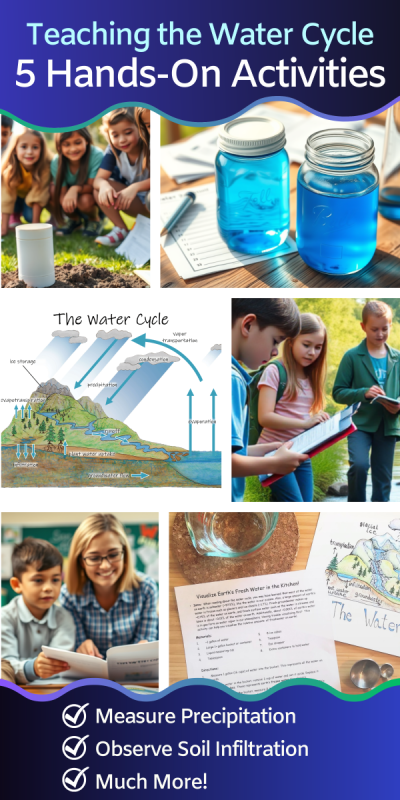
5 Engaging Water Cycle Activities for Students

Grid of 6 pictures showing kids working on water cycle activities outside and in the classroom
text that says share this post

Are you teaching the water cycle in your classroom or homeschool? The water cycle is a complex process with many stages that all work together to provide the freshwater crucial to our survival. Hands-on water cycle activities are useful to demonstrate the different steps in the water cycle and can make your lessons memorable for students. From measuring infiltration to calculating runoff, these 5 water cycle activities will enrich your lessons and deepen understanding.

photo of a piece of paper with the water cycle diagram
Water Cycle Diagram

A Note For Teachers: The activities covered in this post come from three of my complete units: the Water Cycle Unit, Science on the River Unit, and Soil Science Unit. You can purchase these units to receive all the printable worksheets, handouts, and diagrams for teaching these activities and more (plus youโ€™ll support this blog with your purchase! โค๏ธ).

1. Collect Precipitation

images depicting cutting a bottle in half then using the top half to make a funnel into the bottom half
Steps for making a DIY rain gauge from a plastic bottle.

Precipitation happens when water falls to the Earth’s surface in liquid or solid form. This includes water in the form of snowflakes, hail, sleet, or liquid droplets (rain). Precipitation falls onto land or into bodies of water. A lot of precipitation falls directly into the oceans.

Building a DIY rain gauge from a plastic bottle is a fun, hands-on activity to explore this key water cycle process. You just need an empty plastic soda or water bottle plus a few other household items!

But remember, rain is far from the only type of precipitation. If you live somewhere that receives snow in the winter, you can also collect and measure snowfall!

2. Observe Evaporation

A photo showing classroom handouts for teaching evaporation lab activities

Evaporation is the process of water changing from a liquid to a gas, called water vapor. Evaporation may happen anywhere that there is water; water evaporates from oceans, lakes, streams, soils, and even from raindrops as they fall.

Measuring evaporation is an easy activity that brings the process to life for your students. The basic idea of this lab is that you will have two jars, one with a lid and one without. You will observe the change in the water level in the two jars over several days due to evaporation.

3. Measure Soil Infiltration

sketches showing a tube being hammered into the soil then filled with water.
Steps for measuring soil infiltration rates.

Infiltration is when water seeps from the landโ€™s surface down into the soil. This happens when rain falls onto the soil and seeps in. Water also infiltrates downwards through the bottoms of some lakes and streams. Conversely, groundwater may also flow upwards sometimes, into gaining streams and springs.

Measuring infiltration rates in different types of soils is a hands-on activity that helps students explore how water interacts with the ground. This soil infiltration activity also ties in perfectly with studies of porosity and permeability.

The general idea is that you’ll hammer a piece of tubing into the ground, so that the bottom forms a seal with the soil. Then, you’ll fill the tube with water, and time how long it takes the water to seep into the soil. The rate it seeps will vary between different types and textures of soil, so try this activity in a few different locations (e.g., sandy soil, loamy soil, organic-rich soil, etc…).

4. Calculate Run Off in Streams

painting showing three people taking measurements in a stream
Illustration showing students taking stream measurements for calculating stream cross-sectional area and discharge.

Runoff is when water flows downhill. This includes rivers, streams, and any water flowing over the Earth’s surface. Runoff happens thanks to gravity – surface water always flows from high to low elevation. You won’t see a stream flowing uphill. Little streams start high up in the mountains. They flow downhill, joining together to make big rivers. Rivers make their way to the ocean and mix with salt water.

You and your students can measure and calculate the rate of runoff in a small stream. More specifically, you can take simple measurements and use them to calculate the velocity of the flowing water. From there, you can calculate the stream’s discharge (e.g., gallons per minute). This stream measurements activity combines math, measurements, and science, making it a perfect addition to your classroom or homeschool.

5. Model Where Water is Stored

Water cycle diagram, measuring cups, free printable science activity guide for homeschooling, at-home-learning, or elementary school age children.
Printable activity directions and water cycle diagram from my free resources page

Itโ€™s hard to imagine just how little freshwater exists on Earth compared to saltwater. If you’re teaching the water cycle, your students might be amazed to learn that less than 3% of the Earthโ€™s water is freshwaterโ€”the rest is saltwater. Fortunately, you can do a hands-on freshwater learning activity that uses simple kitchen measurements to help your students visualize these proportions. This freshwater visualization activity is a powerful way to help students truly understand how rare freshwater is!

Subscribers to this blog can download free printable directions for this visualization activity on the free resources page of my website. The free resources page is a collection of dozens of printable science & nature learning resources designed by me – including printable activity directions, my hand-drawn water cycle diagram, and much more! To access the free resources page, subscribe to my email newsletter. It’s a monthly digest of new blog posts about science and science education like this one, as well as occasional updates when I release a new unit or throw a sale in my shop.

Study the Water Cycle with Wild Earth Lab!

Thereโ€™s no need to scramble to put together the perfect worksheets and handouts for these water cycle activities โ€“ Iโ€™ve already created them for you! The activities from this post come from these three printable units, available in my shop:

Explore more lessons from Wild Earth Lab:

If you enjoyed this post, I know you will love trying my other printable science and nature units in your classroom too!


Are you interested in reading more posts like this? Subscribe or follow Wild Earth Lab using the links below!


Subscribe, share, and comment:

Posted on Leave a comment

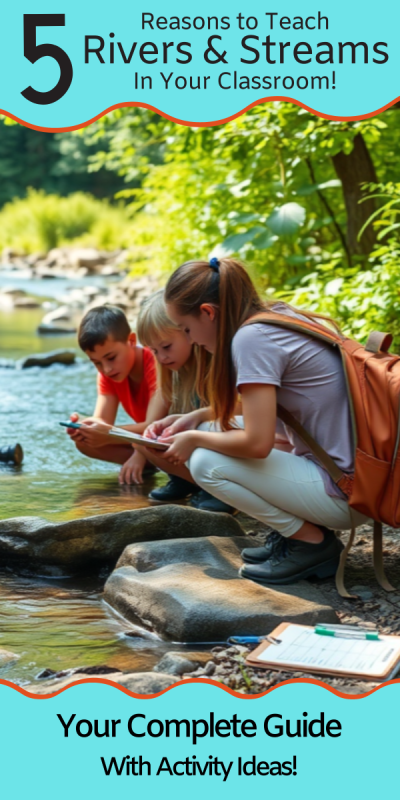
5 Reasons to Teach Rivers and Streams in Your Classroom

students with clipboards kneeling next to a shallow stream
text that says share this post

Rivers and streams provide endless opportunities for scientific exploration and discovery – and chances are you can find one right in your community! From their chemistry and physics to their role in ecosystems and human communities, rivers and streams offer excellent opportunities to teach critical concepts in science and math in an applied way. Across many grade levels, incorporating rivers and streams into your curriculum is a fantastic way to spark curiosity and make learning meaningful. Here are five compelling reasons to study rivers and streams in your classroom this year.

Before we dive in:ย If youโ€™re an educator planning toย teach rivers and streams, great learning resources are key to deepening understanding! I think you and your students will love myย complete Science on the River Unit (plus youโ€™ll support my blog with your purchase! โค๏ธ)

1. Rivers and Streams Are an Interdisciplinary Subject

One of the most exciting aspects of studying rivers and streams is their interdisciplinary nature. Studying natural waterways relates to many fields of science, allowing students to apply knowledge across disciplines:

  • Chemistry: Investigate water quality by measuring pH levels, electrical conductivity, or analyzing dissolved oxygen.
  • Physics: Study fluid mechanics, such as how a stream’s velocity varies with depth, width, and around river bends.
  • Ecology: Explore river ecosystems, food webs, and macroinvertebrate populations that indicate water quality and river health.
  • Geology: Discuss rivers’ role in shaping landscapes and carving out canyons over time.
  • Environmental Science: discuss the challenges facing rivers today, including water conservation, changes in flow due to climate change, pollution from urban and agricultural runoff, and flooding.

By approaching rivers and streams as an interdisciplinary subject, you can help students see how different scientific fields work together to solve real-world problems.

2. Opportunities for Hands-On Learning Activities

Rivers and streams offer a wealth of hands-on learning opportunities that engage students in scientific investigation. Measuring stream flow is a simple yet effective activity that brings science concepts to life. By timing how long it takes for an object to travel a set distance downstream, students can calculate the velocity of a stream.

Other hands-on activities include collecting water samples, catching and identifying aquatic insect larvae, and identifying floodplains and high-water lines. Many of these activities can be conducted with minimal equipment, making them accessible even for classrooms with limited resources. Hands-on learning not only reinforces concepts but also encourages students to ask questions, explore their surroundings, and develop critical thinking skills.

painting showing three people taking measurements in a stream

3. A Perfect Example of Applied Math

Studying rivers and streams is an excellent way to integrate applied math into your science curriculum. Hydrologists and engineers rely on mathematics to analyze water flow, predict floods, and manage water resources. By engaging in similar calculations, students can see how math is used to solve real-world problems. Here are a few ways to apply math when studying rivers:

  • Geometry: students can estimate the cross-sectional area of a river using width and depth data.
  • Arithmetic: students can calculate river discharge using the formula Q=Aร—V, where Q is discharge, A is the cross-sectional area of the stream, and V is the velocity of the flowing water.
  • Probability: students can determine the likelihood of floods based on historical data.
  • Calculus: For more advanced learners, you can introduce calculus concepts like rating curves. Hydrologists use rating curves to estimate stream discharge based on water height.

These activities reinforce math skills and show students how math is a valuable tool for understanding the natural world.

A river cross section divided into multiple rectangles for approximating area

4. A Great Excuse to Take Learning Outside

Studying rivers and streams provides an opportunity to step outside the classroom and into nature. Field trips to local rivers, streams, or creeks allow students to apply textbook knowledge and observe concepts they’ve studied first-hand. They can look for signs of ecosystem health, observe different river features like goosenecks or riffles, and identify types of river channels.

Outdoor activities not only make lessons more memorable but also help students connect with their local environment. A river field trip can foster an appreciation for rivers and nature in general. Connecting with their local rivers on a field trip may even inspire your students to become involved in local conservation and habitat restoration efforts. If you visit a river with your class, spend 15 minutes picking up trash to leave it nicer than you found it.

Woman in waiters stands in a stream while using a hammer and level to adjust stream monitoring station equipment in a mountain valley. Grey smoke can be seen in the background, rising off of the mountainside.
Taking stream measurements.

5. Rivers and Streams Are Vital to Our Communities

Rivers and streams play a critical role in human communities, providing drinking water, supporting agriculture, and offering recreational opportunities. By studying these waterways, students can gain a deeper understanding of how rivers impact their daily lives.

Lessons can focus on the challenges of managing rivers sustainably or the impact of pollution and climate change on streams. For example, you can discuss how urban development affects stormwater runoff or how conservation efforts have improved water quality in a local river. Understanding the role of rivers and streams in our communities helps students see the relevance of their studies and fosters a sense of responsibility for protecting these vital resources.

Study this topic with Wild Earth Lab!

Thereโ€™s no need to scramble to put together the perfect rivers lesson ย โ€“ Iโ€™ve already created it for you! This set includes all the worksheets, project guides, and printable materials you need for studying rivers and streams.

Explore more lessons from Wild Earth Lab:

If you enjoyed this post, I know you will love trying my other printable science and nature units!


Are you interested in reading more posts about fascinating science topics? Subscribe or follow Wild Earth Lab using the links below!


Subscribe, share, and comment:

Posted on Leave a comment

Freshwater Visualization: Learning Activity With Kitchen Measurements

water cycle diagram and worksheet on a table next to measuring cups
text that says share this post

Itโ€™s hard to imagine just how little freshwater exists on Earth compared to saltwater. If you’re teaching the water cycle, your students might be amazed to learn that less than 3% of the Earthโ€™s water is freshwaterโ€”the rest is saltwater. In this post, Iโ€™ll show you a hands-on freshwater learning activity that uses simple kitchen measurements to help your students visualize these proportions. This activity is a powerful way to help students truly understand how rare freshwater is!

Before we dive in:ย If youโ€™re an educator planning toย teach the water cycle, great learning resources are key to deepening understanding! I think you and your students will love my complete Water Cycle Unit (plus youโ€™ll support my blog with your purchase! โค๏ธ)

Background Information

Most of the water on earth is saltwater (~97.5%), like the water in our oceans. Also, a significant amount of earthโ€™s water is frozen such as in glaciers and ice sheets (~1.7%). Fresh groundwater makes up ~0.75% of the water on Earth, and fresh surface water such as the water in streams and lakes is about ~0.01% of the water on Earth. Additionally, about ~0.001% of earthโ€™s water is in its gas form as water vapor in our atmosphere. Having trouble visualizing this?ย  This activity can help you visualize the relative amounts of freshwater on Earth!

Materials

Gather the following materials. You can complete this entire lab with common kitchen measuring cups.

  • ~1 gallon of water
  • Large 1+ gallon bucket or container
  • Liquid measuring cup
  • Tablespoon
  • 8 ice cubes
  • Teaspoon
  • Eye dropper
  • Extra containers to hold water

Step-by-Step Directions

Work through the following steps with your students. Explain what each measurement represents as you work through the activity.

  1. Measure 1 gallon (16 cups) of water into the bucket. This represents all the water on earth.
  2. From the water in the bucket, remove ยผ cup of water and set aside. Replace it with 8 ice cubes. These represent the earthโ€™s frozen water such as glaciers and ice sheets.
  3. From the water in the bucket, measure 2 tablespoons into an extra container.ย  This represents the Earthโ€™s fresh groundwater.
  4. From the water in the bucket, use an eyedropper to measure 8 drops of water into an extra container. This represents all the surface water on earth, such as streams and lakes.
  5. From the water in the bucket, use an eyedropper to measure 1 drop of water into an extra container. The amount of water vapor in our atmosphere at any time is represented by slightly less than this amount!
  6. Look at the water remaining in the bucket. This represents the saltwater on earth, mostly water in our oceans but also including salty groundwater near coasts and saltwater lakes, ponds, and marshes.

Free Printable Directions for This Activity

A printable version of these directions can be found on my free resources page. As my email subscriber, you’ll gain access to the free resources page and get updates about new activity ideas, project guides, new freebies and units, and cool science topics to teach in your classroom! Subscribe now to access the freebies page and more!

Water cycle diagram, measuring cups, free printable science activity guide for homeschooling, at-home-learning, or elementary school age children.

What’s Next?

If you’re teaching the water cycle, I think you’ll love some of my other blog posts too. Read my posts about explaining the water cycle in 10 stages and human impacts on the water cycle. You can also learn how to measure different water cycle processes including evaporation, precipitation, infiltration, and stream flow!

Explore more lessons from Wild Earth Lab:

If you enjoyed this freshwater learning activity, I know you will love trying my printable science and nature units in your classroom too!


Are you interested in reading more posts with science activity ideas? Subscribe or follow Wild Earth Lab using the links below!


Subscribe, share, and comment:

Posted on Leave a comment

Explaining The Water Cycle in 10 Stages

a water cycle diagram and a teacher and student looking at a book
text that says share this post

The water cycle is the process that keeps our planet’s water in constant motion. From evaporation to groundwater flow, each step plays a vital role in shaping our environment and life on our planet. In this post, we’ll explore 10 key processes in the water cycle, breaking down how each one works.

For teachers:ย If youโ€™re an educator planning toย teach the water cycle, great learning resources are key to deepening understanding! I think you and your students will love myย complete Water Cycle Unit (plus youโ€™ll support my blog with your purchase! โค๏ธ)

Evaporation

The sun is like the engine driving the water cycle. That’s because the sun provides energy for water to evaporate. Evaporation is the process of water changing from a liquid to a gas, called water vapor. Evaporation may happen anywhere that there is water; water evaporates from oceans, lakes, streams, soils, and even from raindrops as they fall.

You can observe and measure evaporation in your classroom. It’s an easy, hands-on science experiment. To try it, find the directions in my blog post about measuring evaporation.

Vapor Transportation

When you think of water moving, you may think of rivers and streams. But water also moves around in our atmosphere. Even though we cannot see it, air currents move huge amounts of water in the form of vapor across continents. This is why water that evaporates over an ocean can fall as rain over land.

Condensation

Condensation is the opposite of evaporation. It is the process of water vapor becoming liquid water. Condensation happens in our atmosphere all the time. It happens because as vapor rises in the atmosphere, it cools, making it difficult to stay in the vapor form. This causes little liquid water droplets to form.

If you look up at the sky and see a cloud, you are seeing condensation in action! That’s right: when water condenses in our atmosphere, it creates clouds. Once the water condenses into droplets, they start to fall towards the Earth. If the droplets make it all the way to the ground without re-evaporation, we get rain (or snow or hail if they freeze!).

You can learn more about condensation and the role it plays in forming deserts in my post about the rain shadow effect!

Precipitation

Precipitation happens when water falls to the Earth’s surface in liquid or solid form. This includes water in the form of snowflakes, hail, sleet, or liquid droplets (rain). Precipitation falls onto land or into bodies of water. A lot of precipitation falls directly into the oceans.

When precipitation falls on land, freshwater is formed! When water evaporates from the ocean, the salts are left behind. If the water falls on land, we get freshwater. That freshwater will start slowly making its way back to the ocean in streams and seeping into groundwater, or get stored in lakes and glacial ice.

You can make your own precipitation gauge and measure precipitation with a plastic bottle and a few other household items. Try it out in my blog post on how to measure precipitation with a DIY rain gauge!

Runoff

Runoff is when water flows downhill. This includes rivers, streams, and any water flowing over the Earth’s surface. Runoff happens thanks to gravity – surface water always flows from high to low elevation. You won’t see a stream flowing uphill. Little streams start high up in the mountains. They flow downhill and across the plains, joining together to make big rivers. Rivers make their way to the coasts, where the freshwater is returned to the ocean and mixed with saltwater.

You can learn how to measure the water flowing through a stream in my blog post about stream measurements. It’s a simple activity that can be completed with a few household items and some math skills!

Ice Storage

Not all the water in the water cycle is on the move! Some water becomes trapped for long periods as snow and ice. In cold places like tall mountains and around the poles, frozen water doesn’t thaw, even in summer. In these places, water is stored as ice for centuries or longer! Examples include ice caps, ice sheets, valley glaciers, snowfields, and sea ice.

If you’re interested in learning more about snow and ice, read my blog posts about snow water equivalent and snow hydrology.

Infiltration

Infiltration is when water seeps from the landโ€™s surface down into the soil. This happens when rain falls onto the soil and seeps in. Water also infiltrates downwards through the bottoms of some lakes and streams. Conversely, groundwater may also flow upwards sometimes – into gaining streams and springs.

If you’re interested in learning more about soil infiltration, try measuring it yourself! You can find directions in my blog post on measuring soil infiltration rates.

Plant Water Uptake

Did you know that plants play a role in the water cycle? All plants take up water from the soil through their roots. A single tree may seep up hundreds of gallons of water each year. Now imagine all the trees in a forest doing this – that’s a lot of water!

Transpiration

The water taken up by plant roots doesn’t just disappear. Some of the water is used in a chemical reaction called photosynthesis, in which it is combined with carbon dioxide gas to form oxygen and sugar.

The rest of the water evaporates out of the plant’s leaves in a process called transpiration. Plants have tiny pores in their leaves called stomata that open to release water vapor – similar to how you have pores on your skin that release sweat. The water vapor from the stomata is released into the atmosphere.

Groundwater Flow

Some of the water in the soil gets taken up by plant roots near the ground’s surface. But plenty of water continues to seep down into deeper sediments and rocks. The water fills the tiny gaps in the sediments and rocks known as pore spaces. Water in pore spaces is moving and flowing, just like water on the surface. But groundwater typically moves much, much more slowly than rivers and streams. Some groundwater eventually makes its way back to the surface, for example, into springs.

Teaching the Water Cycle

Thereโ€™s no need to scramble to put together the perfect materials for a Water Cycle lesson  โ€“ Iโ€™ve already created them for you! This set includes all the printable materials you need for studying the Water Cycle.

What’s Next?

Continue reading about human impacts on the water cycle. Or, find classroom activities for water cycle processes in my posts outlining classroom activities for evaporation, precipitation, infiltration, and stream flow!

I also created a few water cycle-related free printables and activities, which are available to my email subscribers on my free resources page. These free materials include my original hand-drawn water cycle diagram, water bingo, and printable directions for a freshwater visualization activity.

Find your next science topic from Wild Earth Lab:

If you enjoyed this post, I know you will love trying my other science and nature units in your classroom or homeschool too!


Are you interested in reading more posts like this? Subscribe or follow Wild Earth Lab using the links below!


Subscribe, share, and comment:

Posted on Leave a comment

Measuring Soil Infiltration Rates: A Science Classroom Activity

students observe a white cylinder inserted into the soil
text that says share this post

Are you teaching the water cycle or studying soil in your classroom or homeschool? Measuring infiltration rates in different types of soils is a hands-on activity that helps students explore how water interacts with the ground. This soil infiltration activity also ties in perfectly with studies of porosity and permeability. This engaging experiment works as a stand-alone lesson or as part of a broader unit on soil science or the water cycle.

Before we dive in: The activity from this post comes from my complete Water Cycle Unit. If youโ€™re an educator planning to teach infiltration and the water cycle, you’ll find printable directions, worksheets, and much more in the Water Cycle Unit (plus youโ€™ll support my blog with your purchase! โค๏ธ)

Materials

Gather the following materials to complete this activity:

  • Short tube or pipe with openings on both ends, something sturdy works best:
    • A short PVC pipe
    • Or potentially a sturdy can opened on both ends (file down any sharp edges before use)
  • Ruler
  • Permanent marker
  • Hammer or rubber mallet
  • Water
  • Stopwatch
  • Student worksheets & printable directions (available in my Water Cycle Unit!)
A photo showing classroom handouts for studying infiltration of water into soil

Measuring Soil Infiltration: Step-by-Step Directions

The basic idea of this soil infiltration activity is that you will hammer a tube shallowly into the soil, then pour water in, and observe the water level drop as the water seeps into the ground. Assist your students as they work through the following steps.

Pre-Lab

In this lab, students will compare the infiltration rate in at least three different locations with different types of soil. For example, they could compare a sandy soil, a clay soil, and a soil rich in organic matter.

Before starting the lab activity, ask your students to observe and handle the three different soils. Students should write a description of each soil’s observable properties (color, texture, moisture, particle size). Then, students should predict which soils will have the highest and lowest infiltration rates. Students should explain their reasoning for their predictions.

Part 1: Set Up Your Infiltrometer

First, you and your students will need to set up your “infiltrometer” (tube for measuring infiltration rates).

  1. Use a ruler and permanent marker to make measurement markings up the inside of the tube, starting from one end.
  2. Hammer the infiltrometer (tube) into the soil โ€“ the goal is to create a seal with the soil so that water wonโ€™t leak out under the tubeโ€™s rim. (An adult should complete this step for younger students.)
sketches showing a tube being hammered into the soil then filled with water.

Part 2: Measure Infiltration

Once you’ve set up the infiltrometer, you are ready to continue with the soil infiltration activity and collect your measurements.

  1. Pour water into the infiltrometer.
  2. Note the starting height of the water and start the stopwatch.
  3. Watch the water level in the infiltrometer lower as the water seeps into the soil.
  4. Repeatedly record the water level over time on the student worksheet.
  5. Repeat in different soils โ€“ compare a sandy soil, flowerbeds, mulch, gravel, sand, compost, etc.

Post-Lab

For an extra math challenge: Calculate the infiltration rate for each of the soils:

You may also wish to ask your students to reflect on their predictions. Were their predictions correct? Which soil had the highest infiltration rate? The lowest? What might cause this?

What’s Next?

Once you’ve measured infiltration, why not measure other water cycle processes? Be sure to check out my blog post explaining how to measure evaporation and my post on making a DIY rain gauge to measure precipitation with your students!

Materials for Teaching Infiltration and the Water Cycle

Save time preparing for this activity! My Water Cycle Unit includes printable directions and worksheets for this activity and two other water cycle activities. Plus flashcards, diagrams, and more. Check it out:

photo of at home science lab activity handouts and worksheets

Explore more lessons from Wild Earth Lab:

If you enjoyed this post, I know you will love trying my other printable science and nature units in your classroom too!


Are you interested in reading more posts with science activity ideas? Don’t forget to subscribe or follow Wild Earth Lab using the links below!


Subscribe, share, and comment:

Posted on Leave a comment

DIY Rain Gauge Activity for Teaching the Water Cycle

plastic bottles and scissors on a classroom desk
text that says share this post

Teaching your students about the water cycle? Building a DIY rain gauge from a plastic bottle is a fun, hands-on activity to explore a key water cycle process: precipitation. This simple project is perfect for your classroom or homeschool and can be a stand-alone lesson or part of a larger study of water cycle processes.

Before we dive in:ย The activity from this post comes from my complete Water Cycle Unit. If youโ€™re an educator planning toย teach precipitation and the water cycle, you’ll find printable directions, worksheets, and much more in the Water Cycle Unit (plus youโ€™ll support my blog with your purchase! โค๏ธ)

Materials

Gather the following materials to complete this activity:

  • 2 empty plastic soda bottles of the same size
  • Scissors
  • Ruler
  • Permanent marker
  • Student worksheets & printable directions (available in my Water Cycle Unit!)
A photo showing classroom handouts for teaching students how to build a precipitation gauge

Measuring Precipitation: Step-by-Step Directions

The basic idea of this lab is that you will build your own rain gauges out of plastic soda bottles and then use them to collect and measure precipitation in two places. Assist your students as they work through the following steps.

Pre-Lab

In this lab, students will compare the precipitation measured in at least two different locations. For example, they could compare an area with trees and an area out in the open. Or they could give one rain gauge to a friend on the opposite side of town.

Before starting the lab activity, ask your students to make some predictions and explain their reasoning. Which location will receive more precipitation? Or will both locations receive the same amount? Explain your reasoning.

Part 1: Make Your Precipitation Gauge

You will need to build your precipitation gauges and then wait several days to collect your results. First, here’s how to make your own precipitation gauges from plastic bottles:

  1. Cut the plastic soda bottles in half below the tapered necks (an adult should do this step for younger children).
  2. Turn the bottlenecks upside down to make funnels.
  3. Use a ruler and permanent marker to make measurement markings (e.g., centimeters or inches) up the side of the bottle, starting from the bottom.
images depicting cutting a bottle in half then using the top half to make a funnel into the bottom half

Part 2: Measure Precipitation

Several days later, complete the experiment:

  1. Place each precipitation gauge outside. You may wish to stack rocks around the gauges to keep them from tipping over.
  2. Compare the precipitation in two locations. Try placing one precipitation gauge somewhere with trees and one out in the open. Or give one gauge to a friend or family member who lives nearby.
  3. In winter, if you have snow, remove the funnel from the top of each gauge bottle to allow snow to fall directly into the base of the bottle. Bring the gauge inside to allow the collected snow to melt to measure snow water equivalent.

Post-Lab

For an extra math challenge: Measure the diameter (D) of the precipitation gauge and then calculate the volume of water that you collected in each rain gauge using the volume of a cylinder equation:

volume of a cylinder equations

You may also wish to ask your students to reflect on their predictions. Were their predictions correct? Which location received more precipitation? What mechanism might have caused this?

What’s Next?

Once you’ve measured precipitation, why not measure other water cycle processes? Be sure to check out my blog post explaining how to measure stream flow with your students and how to measure evaporation!

Materials for Teaching Precipitation and the Water Cycle

Save time preparing for this activity! My Water Cycle Unit includes printable directions and worksheets for this activity and two other water cycle activities. Plus flashcards, diagrams, and more. Check it out:

photo of at home science lab activity handouts and worksheets

Explore more lessons from Wild Earth Lab:

If you enjoyed this post, I know you will love trying my other printable science and nature units in your classroom too!


Are you interested in reading more posts with science activity ideas? Subscribe or follow Wild Earth Lab using the links below!


Subscribe, share, and comment:

Posted on Leave a comment

Hands-On Water Cycle Activity: Measure Evaporation

Jars with blue water
text that says share this post

Looking for a simple, hands-on way to teach the water cycle? Measuring evaporation is an easy activity that brings the process to life for your students. Perfect for classrooms or homeschools, this experiment makes learning about the water cycle engaging and interactive! You can measure evaporation as a stand-alone activity or as part of a larger exploration of water cycle processes.

Before we dive in: The activity from this post comes from my complete Water Cycle Unit. If youโ€™re an educator planning to teach evaporation and the water cycle, you’ll find printable directions, worksheets, and much more in the Water Cycle Unit (plus youโ€™ll support my blog with your purchase! โค๏ธ)

Materials

Gather the following materials to complete this activity:

  • Two small see-through jars or cups
  • Liquid measuring cup (or graduated cylinder)
  • Water
  • Food coloring
  • Permanent marker
  • Student worksheets & printable directions (available in my Water Cycle Unit!)
A photo showing classroom handouts for teaching evaporation lab activities

Measuring Evaporation: Step-by-Step Directions

The basic idea of this lab is that you will have two jars, one with a lid and one without. You will observe the change in the water level in the two jars over several days due to evaporation. Assist your students as they work through the following steps.

Pre-Lab

Before starting the lab activity, ask your students to make some predictions and explain their reasoning.

Will the jar with the lid:

  • Loose water?
  • Gain water?
  • Remain the same?

Will the jar without a lid:

  • Loose water?
  • Gain water?
  • Remain the same?

Part 1: Set Up

You will need to set up the experiment and then wait several days to collect your results. On the first day, take the following steps:

  1. Use a liquid measuring cup to measure equal amounts of water into two small glass jars.
  2. Put a drop of food coloring in each jar.
  3. Use the marker to mark the water level in each jar.
  4. Leave one jar open. Put a lid on the other jar โ€“ this will be your control. Discuss with your classmates and/or instructor the purpose of a control in a science experiment.
  5. Place the jars under a covered area so rain canโ€™t fall into them. Wait several days or weeks. Evaporation may occur very slowly in humid climates.

Part 2: Measure Evaporation

Several days later, complete the experiment:

  1. Once the water level is visibly lower in the open jar, use the graduated cylinder or liquid measuring cup to measure the amount of water in each jar. Record the volume on the student worksheet.
  2. The difference between the two jars is the amount of water that evaporated.
  3. Discuss whether water evaporated from each jar โ€“ why or why not?

Post-Lab

Ask your students to reflect on their predictions. Were their predictions correct? Why or why not? Which jar lost water? What caused it to lose water?

What’s Next?

Are your students up for a bigger challenge? Now that you’ve observed evaporation, why not measure some other water cycle processes? Be sure to check out my blog post explaining how to measure stream flow with your students and how to measure snow!

Materials for Teaching Evaporation and the Water Cycle

Save time preparing for this activity! My Water Cycle Unit includes printable directions and worksheets for this activity and two other water cycle activities. Plus flashcards, diagrams, and more. Check it out:

photo of at home science lab activity handouts and worksheets

Explore more lessons from Wild Earth Lab:

If you enjoyed this post, I know you will love trying my other printable science and nature units in your classroom too!


Are you interested in reading more posts with science activity ideas? Subscribe or follow Wild Earth Lab using the links below!


Subscribe, share, and comment:

Posted on Leave a comment

Measuring Snow: hands-on classroom activity to learn about snow hydrology and the water cycle!

banner with a picture of classroom handouts and the text "study snow hydrology and the water cycle - snow measurements lab"

If you live somewhere that gets snow in winter, you’ve likely measured the depth of snow before! But with a few extra steps, you can turn this simple task into an awesome, hands-on snow measurements lab activity for your classroom.

Find these worksheets and handouts in my snow hydrology lab mini study!

By measuring snow and performing calculations, we can determine snow water equivalent, stored water, and snow-to-liquid ratios! These are all important measurements for snow hydrologists and tell us a lot about water resources and the water cycle.

In this post, you will learn how to set up your own snow measurements lab to try out in your classroom! You can also get printable versions of these directions plus worksheets, handouts, and classroom posters to go along with this lab in my Bird Beak Adaptations Lab Mini Study!

Find these worksheets and handouts in my snow hydrology lab mini study!

Gather Your Materials

Gather the following materials for the snow measurements lab:

Part 1: Water in Snow

  • Printed copies of the โ€œWater in Snowโ€ worksheets (1 set per student)
  • 3 identical jars with lids
  • Water
  • Freshly fallen snow (not โ€œslushโ€ or partially melted snow)
  • Ice cubes

Part 2: Snow Water Equivalent

Set Up and Directions

Part 1: Water in Snow

  1. Fill one jar with liquid water, one jar with snow, and one jar with ice cubes. Fill all jars to the same level.
  2. Place a lid on each jar to prevent evaporative water loss.
  3. Put the jars somewhere indoors to melt.
  4. Ask students to make predictions about the water levels in each jar. Which jar will hold the most water at the end of the experiment? Which will hold the least?
  5. Encourage students to discuss their reasoning. They may notice that the jar with the ice cubes visibly contains a lot of air. For this reason, some students may expect that the ice cube jar will have the lowest water level at the end of the experiment.
  6. You may also ask students to draw a line on each jar to show where they think the water level will be.
  7. Once everything melts, ask students to check if their predictions were correct. Which jar holds the most water now? Which jar holds the least water now?
  8. Discuss how different types of snow (e.g., a fluffy, dry snow and a heavier, wet snow) will have different proportions of water and air in them. Share with students that snow hydrologists are often interested in the โ€œSnow Water Equivalentโ€, or in other words, the amount of water in snow.

Part 2: Snow Water Equivalent

  1. Start by sharing with students that precipitation (e.g., snow, rain) is measured as a depth.
  2. We can measure this depth by setting an open container outside to collect precipitation as it falls.
  3. Help students use the rulers to draw and label measurement markings up the side of the container, starting at the bottom.
  4. Ask students to set these containers outside before it snows. If it is windy, students may need to place rocks or other heavy items around the containers to hold them in place. When the snow stops, students should record the depth, bring the container indoors, then wait for the snow to melt in the container.
  5. Once students determine the Snow Water Equivalent (i.e., the depth of meltwater in the container), help them calculate a snow-to-liquid ratio (SLR). You may wish to work through the example on the student handout as a class.

Other Suggestions

  • The snow and ice cubes may melt slowly. If you donโ€™t have a long class period, set up this activity at the end of class one day, then finish the activity at the start of class the next day.
  • Donโ€™t pack down the snow in the jar, since this may impact the snowโ€™s density.

Reflection Questions

  1. Water only makes up a small part of snowโ€™s volume. What could make up the rest of the snow? (What else is in the jar?).
  2. Imagine you have one jar with a fluffy, fresh snow, and one jar with a heavy, dense snow that was on the ground for a few days. After melting, which jar would have more liquid water? Why?
  3. Which would be more water: an inch of rain or an inch of snowfall? Why?
  4. If 21 inches of snow falls, and the snow-to-liquid ratio is 7 : 1, what is the snow water equivalent?
  5. Could snow water equivalent ever be a larger number than snow depth? Why or why not?

This activity comes from my Science in the Snow Unit!

Your students will love the illustrated learning materials, plus you’ll support Wild Earth Lab with your curriculum purchase!

Explore more curriculum from Wild Earth Lab:

If you enjoyed this post, I know you will love using my environmental science materials in your classroom!


Are you interested in reading more posts like this? Subscribe or follow Wild Earth Lab using the links below!

Sharing options and discussion for this post:

Posted on 7 Comments

Common Water Features: examples (with links!) and descriptions!

A painting of a mountain waterfall with text that says "Types of water bodies! with definitions and examples" and "plus: take a virtual field trip with Google Maps Links"

About common water features

Before diving into definitions and examples of some common water features, let us ask: “What is a water feature?” Water features are any water body or waterway found on the Earth’s surface!

Water features come in a wide variety of shapes and sizes! For example, some water features are lotic (flowing, like a stream), while others are lentic (stagnant, non-flowing, like a pond). Additionally, water features can have freshwater, saltwater, or a combination of the two (such as brackish water found in coastal wetlands and estuaries). Furthermore, many water features are natural, but also sometimes human-made, like reservoirs and canals.

A Special Note For Teachers: if you are an educator planning a water features unit, you’ll find more information about these different types of water features within my water features unit. You can check it out in my shop, where I offer learning materials for a variety of environmental science units.

Recommended products

Water moves between different water features (and into the air, ground, and ice) through the water cycle. The water cycle is an ongoing process moving water from the oceans to the land and back. To start, the sun powers the water cycle, providing energy for water to evaporate. This creates freshwater and makes it possible for water to move from oceans and low areas to higher places. Then, water flows downhill and makes its way back to the ocean. You can also learn about how humans impact the water cycle in my post from last year.

Bays & Gulfs

A bay is a body of salt water along a coast that is partially enclosed by land. The mouth of a bay is the side that is open to a larger body of water like a sea or ocean. Sometimes, a bay may be called a cove. Gulfs are similar to bays but larger.

Examples of Bays

Examples of Gulfs

Hanauma Bay in Hawaii

Deltas

A delta is a landform of deposited sediments where a river or stream meets the ocean. Sediments settle out of the river water as it flows into the slower-moving ocean or sea. The movement of water through a delta is controlled by the flow of the river.

Examples of Deltas

Estuaries

An estuary is a partially enclosed body of water where a slow-moving river or stream meets the ocean. Notably, estuaries contain mixed freshwater and salt water. The movement of water through estuaries is controlled by waves and tides as well as by the flow of the river.

Examples of Estuaries

estuary from above
Photo by Pok Rie on Pexels.com

Lakes

A lake is a stagnant or non-flowing body of surface water. However, many lakes are fed by small inlet streams. Similarly, ponds are also non-flowing bodies of surface water. However, ponds are shallower and usually smaller than lakes.

Examples of Lakes

Devil’s Lake in Wisconsin

Oceans & Seas

Oceans are vast bodies of salt water. Earthโ€™s ocean is a continuous body of water, but geographically we divide it into 4 oceans: the Arctic, Atlantic, Indian, and Pacific. Similarly, seas are smaller areas of salt water, also connected to the ocean. All together, oceans and seas cover about 70% of earth.

Examples of Oceans

Examples of Seas

View of the Atlantic Ocean, off the coast of North Carolina, USA

Ponds

A pond is a stagnant or non-flowing body of surface water. However, many ponds are fed by small inlet streams. Ponds are shallower and typically smaller than lakes.

Examples of Ponds

Small pond in Colorado beneath Vestal and Arrow Peaks.

Springs

A spring is where groundwater naturally flows onto the earthโ€™s surface. Specifically, a spring forms when the water table is at the same or a higher level than the landโ€™s surface. Springs are often found on steep hillsides or in valley bottoms. Springs may form the beginnings of streams and rivers.

Examples of Springs

Streams

A stream is a flowing channel of surface water. Streams may also be called creeks and brooks. Large streams are called rivers. However, the size at which a “creek” or “brook” becomes a “river” varies dramatically between regions. Perennial streams flow year-round. Seasonal and intermittent streams will dry up at certain times of year or when the weather is hotter and drier.

Examples of Streams, Brooks, Creeks, and Rivers

A stream in northern Wisconsin

Waterfalls

A waterfall is where a stream becomes vertical or nearly vertical. Waterfalls are found in places that streams flow over steep mountainsides and cliffs. Often, deep plunge pools are found at the bottom of waterfalls.

Examples of Waterfalls

Small waterfall near Leadville, CO
photo of printed classroom posters and flashcards
Find these printable handouts, flashcards, and worksheets in my complete Water Bodies Unit

Wetlands

Wetlands are areas of land flooded or saturated with water. Additionally, wetlands are filled with plants that are adapted for life in flooded environments. Furthermore, wetlands may either last year-round or dry up seasonally. Other names for wetlands include bogs, marshes, and swamps.

Examples of Wetlands, Bogs, Marshes, and Swamps

A wetland during a part of the year with low waters, along the Appalachian Trail

Ditches & Canals

A ditch is a human-made stream, created to transport flowing water from one area to another. Ditches can move floodwater away from an area where it is not wanted or bring water to an area where it is needed. Similarly, Canals are also human-made streams. However, canals are large enough to allow for boats to pass through them.

Examples of Ditches

Examples of Canals

A small human-made ditch in Fort Collins, Colorado moves water from a reservoir to farm fields.

Reservoirs

A reservoir is a man-made lake or pond, created to store water for later use. Reservoirs are built by  damming a river or stream which forces water to pool upstream. Reservoirs supply year-round water in regions where most of the annual precipitation falls during a short period.

Examples of Reservoirs

What about landforms?

Continue reading about common landforms in this separate post on common landforms!

Teach Water Bodies and Landforms with Wild Earth Lab:

Are you planning to teach landforms and water features? You may enjoy the learning materials I’ve created on these topics! All my learning materials feature my artwork! Find them in my shop or click on the links below:

Find Your Next Earth Science Topic With Wild Earth Lab:

Ready to explore your next Earth science topic? Get started with one of these blog posts

Explore more Wild Earth Lab science units…


Are you interested in reading more about Earth Sciences? If so, please subscribe or follow Wild Earth Lab using the links below!


Sharing options and discussion for this post:

Posted on 6 Comments

Mountains and the Water Cycle: the rain shadow effect explained

a brown and green mountain

A short bonus post here! After writing two posts about the water cycle (how it works and how humans effect it), I still felt like there was more to write. I owed it to the wonderful mountains where I live, to touch on the important role of mountains in the water cycle. In this mini post, we will cover the rain shadow effect and how mountains impact the water cycle!

Mountains play a key role in the water cycle! Pictured here is Colorado’s Huron Peak, viewed from Lake Ann Pass.

Mountainsโ€™ important role in the water cycle

Here in the Rocky Mountains, we are approaching an important time of the year: spring snowmelt! Throughout the winter, snow builds up in the mountains, then when warmer weather comes, it rapidly melts, causing a massive increase in the flows of streams and rivers. The water that starts in the mountains benefits all sorts of downstream users – fish like salmon that travel dozens or even hundreds of miles through rivers, riparian plants like willows and aspen that thrive near streams, and all sorts of animals that need water for drinking or habitat purposes. And of course, people use this water – from mountain towns to coastal cities and anywhere in between! Scientists have aptly described mountains as the water towers of the world. Whether you live near mountains or not, water resources near you are likely impacted by the seasonal cycle of snow building up and melting in mountains.ย 

But why do mountains get so much precipitation, to begin with? The answer relates to the water cycle and temperature. When air comes off of the ocean and starts moving across a continent, it is warm and has lots of water vapor. As that air moves inland and encounters mountains, it must move upwards to pass over the mountains. You may recall from my recent post on the water cycle that as water vapor rises up in the atmosphere it cools and condenses into liquid water droplets. As the tall mountains force air to travel higher, the cooler temperatures at greater elevations cause water vapor to condense and fall as raindrops or snowflakes, depending on the temperature.

The side of the mountain where the air travels up first will receive lots of precipitation. As air moves lower down the opposite side of the mountain, it becomes warmer again. But now, that air has less vapor than before because it lost water as precipitation while traveling over the mountains. The result is warmer, drier air on the inland side of the mountains. This is why we often see lots of precipitation on one side of mountains and arid regions or deserts on the other side. This noticeable difference is called the rain shadow effect.ย 

A massive thunderstorm rolls in over the San Juan mountains, as seen from Snow Mesa. It sure was scary being where I was to take this picture.

In the Rocky Mountains, air generally moves eastward: traveling from the Pacific Ocean and moving east across North America. This is why the western slope of the Rocky Mountains experiences more snow than the Front Range on the east side. However, demand for water is high on the east side of the mountains, where many people live in cities such as Denver and Colorado Springs. To keep up with the demand for water, humans actually move water from the west side to the east side of the Rocky Mountains using man-made ditches high in the mountains, that catch and divert snowmelt from where it would naturally flow. Where humans live doesnโ€™t always match up with where water resources are available. This motivates us to alter the water cycle to meet our needs…

Continue reading about the ways humans impact the water cycle.

Or learn about how the water cycle works.

Or download and print a water cycle poster!


Are you interested in reading more posts about earth sciences and nature? Subscribe or follow Wild Earth Lab using the links below!


References and Further Reading

  1. Kennedy, C. (2011). Rain shadows on the summits of Hawaii. NOAA Climate.gov. Available: https://www.climate.gov/news-features/featured-images/rain-shadows-summits-hawaii
  2. Plummer, C. C., Carlson, D. H., & Hammersley L. (2019) Physical Geology. New York, NY: McGraw-Hill Education. (16th ed., pp. 232 โ€“ 320).

Sharing options and discussion for this post: