Posted on — Leave a comment

Freshwater Visualization: Learning Activity With Kitchen Measurements

water cycle diagram and worksheet on a table next to measuring cups
text that says share this post

It’s hard to imagine just how little freshwater exists on Earth compared to saltwater. If you’re teaching the water cycle, your students might be amazed to learn that less than 3% of the Earth’s water is freshwater—the rest is saltwater. In this post, I’ll show you a hands-on freshwater learning activity that uses simple kitchen measurements to help your students visualize these proportions. This activity is a powerful way to help students truly understand how rare freshwater is!

Before we dive in: If you’re an educator planning to teach the water cycle, great learning resources are key to deepening understanding! I think you and your students will love my complete Water Cycle Unit (plus you’ll support my blog with your purchase! ❤️)

Background Information

Most of the water on earth is saltwater (~97.5%), like the water in our oceans. Also, a significant amount of earth’s water is frozen such as in glaciers and ice sheets (~1.7%). Fresh groundwater makes up ~0.75% of the water on Earth, and fresh surface water such as the water in streams and lakes is about ~0.01% of the water on Earth. Additionally, about ~0.001% of earth’s water is in its gas form as water vapor in our atmosphere. Having trouble visualizing this?  This activity can help you visualize the relative amounts of freshwater on Earth!

Materials

Gather the following materials. You can complete this entire lab with common kitchen measuring cups.

  • ~1 gallon of water
  • Large 1+ gallon bucket or container
  • Liquid measuring cup
  • Tablespoon
  • 8 ice cubes
  • Teaspoon
  • Eye dropper
  • Extra containers to hold water

Step-by-Step Directions

Work through the following steps with your students. Explain what each measurement represents as you work through the activity.

  1. Measure 1 gallon (16 cups) of water into the bucket. This represents all the water on earth.
  2. From the water in the bucket, remove ¼ cup of water and set aside. Replace it with 8 ice cubes. These represent the earth’s frozen water such as glaciers and ice sheets.
  3. From the water in the bucket, measure 2 tablespoons into an extra container.  This represents the Earth’s fresh groundwater.
  4. From the water in the bucket, use an eyedropper to measure 8 drops of water into an extra container. This represents all the surface water on earth, such as streams and lakes.
  5. From the water in the bucket, use an eyedropper to measure 1 drop of water into an extra container. The amount of water vapor in our atmosphere at any time is represented by slightly less than this amount!
  6. Look at the water remaining in the bucket. This represents the saltwater on earth, mostly water in our oceans but also including salty groundwater near coasts and saltwater lakes, ponds, and marshes.

Free Printable Directions for This Activity

A printable version of these directions can be found on my free resources page. As my email subscriber, you’ll gain access to the free resources page and get updates about new activity ideas, project guides, new freebies and units, and cool science topics to teach in your classroom! Subscribe now to access the freebies page and more!

Water cycle diagram, measuring cups, free printable science activity guide for homeschooling, at-home-learning, or elementary school age children.

What’s Next?

If you’re teaching the water cycle, I think you’ll love some of my other blog posts too. Read my posts about explaining the water cycle in 10 stages and human impacts on the water cycle. You can also learn how to measure different water cycle processes including evaporation, precipitation, infiltration, and stream flow!

Explore more lessons from Wild Earth Lab:

If you enjoyed this freshwater learning activity, I know you will love trying my printable science and nature units in your classroom too!


Are you interested in reading more posts with science activity ideas? Subscribe or follow Wild Earth Lab using the links below!


Subscribe, share, and comment:

Posted on — Leave a comment

Explaining The Water Cycle in 10 Stages

a water cycle diagram and a teacher and student looking at a book
text that says share this post

The water cycle is the process that keeps our planet’s water in constant motion. From evaporation to groundwater flow, each step plays a vital role in shaping our environment and life on our planet. In this post, we’ll explore 10 key processes in the water cycle, breaking down how each one works.

For teachers: If you’re an educator planning to teach the water cycle, great learning resources are key to deepening understanding! I think you and your students will love my complete Water Cycle Unit (plus you’ll support my blog with your purchase! ❤️)

Evaporation

The sun is like the engine driving the water cycle. That’s because the sun provides energy for water to evaporate. Evaporation is the process of water changing from a liquid to a gas, called water vapor. Evaporation may happen anywhere that there is water; water evaporates from oceans, lakes, streams, soils, and even from raindrops as they fall.

You can observe and measure evaporation in your classroom. It’s an easy, hands-on science experiment. To try it, find the directions in my blog post about measuring evaporation.

Vapor Transportation

When you think of water moving, you may think of rivers and streams. But water also moves around in our atmosphere. Even though we cannot see it, air currents move huge amounts of water in the form of vapor across continents. This is why water that evaporates over an ocean can fall as rain over land.

Condensation

Condensation is the opposite of evaporation. It is the process of water vapor becoming liquid water. Condensation happens in our atmosphere all the time. It happens because as vapor rises in the atmosphere, it cools, making it difficult to stay in the vapor form. This causes little liquid water droplets to form.

If you look up at the sky and see a cloud, you are seeing condensation in action! That’s right: when water condenses in our atmosphere, it creates clouds. Once the water condenses into droplets, they start to fall towards the Earth. If the droplets make it all the way to the ground without re-evaporation, we get rain (or snow or hail if they freeze!).

You can learn more about condensation and the role it plays in forming deserts in my post about the rain shadow effect!

Precipitation

Precipitation happens when water falls to the Earth’s surface in liquid or solid form. This includes water in the form of snowflakes, hail, sleet, or liquid droplets (rain). Precipitation falls onto land or into bodies of water. A lot of precipitation falls directly into the oceans.

When precipitation falls on land, freshwater is formed! When water evaporates from the ocean, the salts are left behind. If the water falls on land, we get freshwater. That freshwater will start slowly making its way back to the ocean in streams and seeping into groundwater, or get stored in lakes and glacial ice.

You can make your own precipitation gauge and measure precipitation with a plastic bottle and a few other household items. Try it out in my blog post on how to measure precipitation with a DIY rain gauge!

Runoff

Runoff is when water flows downhill. This includes rivers, streams, and any water flowing over the Earth’s surface. Runoff happens thanks to gravity – surface water always flows from high to low elevation. You won’t see a stream flowing uphill. Little streams start high up in the mountains. They flow downhill and across the plains, joining together to make big rivers. Rivers make their way to the coasts, where the freshwater is returned to the ocean and mixed with saltwater.

You can learn how to measure the water flowing through a stream in my blog post about stream measurements. It’s a simple activity that can be completed with a few household items and some math skills!

Ice Storage

Not all the water in the water cycle is on the move! Some water becomes trapped for long periods as snow and ice. In cold places like tall mountains and around the poles, frozen water doesn’t thaw, even in summer. In these places, water is stored as ice for centuries or longer! Examples include ice caps, ice sheets, valley glaciers, snowfields, and sea ice.

If you’re interested in learning more about snow and ice, read my blog posts about snow water equivalent and snow hydrology.

Infiltration

Infiltration is when water seeps from the land’s surface down into the soil. This happens when rain falls onto the soil and seeps in. Water also infiltrates downwards through the bottoms of some lakes and streams. Conversely, groundwater may also flow upwards sometimes – into gaining streams and springs.

If you’re interested in learning more about soil infiltration, try measuring it yourself! You can find directions in my blog post on measuring soil infiltration rates.

Plant Water Uptake

Did you know that plants play a role in the water cycle? All plants take up water from the soil through their roots. A single tree may seep up hundreds of gallons of water each year. Now imagine all the trees in a forest doing this – that’s a lot of water!

Transpiration

The water taken up by plant roots doesn’t just disappear. Some of the water is used in a chemical reaction called photosynthesis, in which it is combined with carbon dioxide gas to form oxygen and sugar.

The rest of the water evaporates out of the plant’s leaves in a process called transpiration. Plants have tiny pores in their leaves called stomata that open to release water vapor – similar to how you have pores on your skin that release sweat. The water vapor from the stomata is released into the atmosphere.

Groundwater Flow

Some of the water in the soil gets taken up by plant roots near the ground’s surface. But plenty of water continues to seep down into deeper sediments and rocks. The water fills the tiny gaps in the sediments and rocks known as pore spaces. Water in pore spaces is moving and flowing, just like water on the surface. But groundwater typically moves much, much more slowly than rivers and streams. Some groundwater eventually makes its way back to the surface, for example, into springs.

Teaching the Water Cycle

There’s no need to scramble to put together the perfect materials for a Water Cycle lesson  – I’ve already created them for you! This set includes all the printable materials you need for studying the Water Cycle.

What’s Next?

Continue reading about human impacts on the water cycle. Or, find classroom activities for water cycle processes in my posts outlining classroom activities for evaporation, precipitation, infiltration, and stream flow!

I also created a few water cycle-related free printables and activities, which are available to my email subscribers on my free resources page. These free materials include my original hand-drawn water cycle diagram, water bingo, and printable directions for a freshwater visualization activity.

Find your next science topic from Wild Earth Lab:

If you enjoyed this post, I know you will love trying my other science and nature units in your classroom or homeschool too!


Are you interested in reading more posts like this? Subscribe or follow Wild Earth Lab using the links below!


Subscribe, share, and comment:

Posted on — Leave a comment

Measuring Soil Infiltration Rates: A Science Classroom Activity

students observe a white cylinder inserted into the soil
text that says share this post

Are you teaching the water cycle or studying soil in your classroom or homeschool? Measuring infiltration rates in different types of soils is a hands-on activity that helps students explore how water interacts with the ground. This soil infiltration activity also ties in perfectly with studies of porosity and permeability. This engaging experiment works as a stand-alone lesson or as part of a broader unit on soil science or the water cycle.

Before we dive in: The activity from this post comes from my complete Water Cycle Unit. If you’re an educator planning to teach infiltration and the water cycle, you’ll find printable directions, worksheets, and much more in the Water Cycle Unit (plus you’ll support my blog with your purchase! ❤️)

Materials

Gather the following materials to complete this activity:

  • Short tube or pipe with openings on both ends, something sturdy works best:
    • A short PVC pipe
    • Or potentially a sturdy can opened on both ends (file down any sharp edges before use)
  • Ruler
  • Permanent marker
  • Hammer or rubber mallet
  • Water
  • Stopwatch
  • Student worksheets & printable directions (available in my Water Cycle Unit!)
A photo showing classroom handouts for studying infiltration of water into soil

Measuring Soil Infiltration: Step-by-Step Directions

The basic idea of this soil infiltration activity is that you will hammer a tube shallowly into the soil, then pour water in, and observe the water level drop as the water seeps into the ground. Assist your students as they work through the following steps.

Pre-Lab

In this lab, students will compare the infiltration rate in at least three different locations with different types of soil. For example, they could compare a sandy soil, a clay soil, and a soil rich in organic matter.

Before starting the lab activity, ask your students to observe and handle the three different soils. Students should write a description of each soil’s observable properties (color, texture, moisture, particle size). Then, students should predict which soils will have the highest and lowest infiltration rates. Students should explain their reasoning for their predictions.

Part 1: Set Up Your Infiltrometer

First, you and your students will need to set up your “infiltrometer” (tube for measuring infiltration rates).

  1. Use a ruler and permanent marker to make measurement markings up the inside of the tube, starting from one end.
  2. Hammer the infiltrometer (tube) into the soil – the goal is to create a seal with the soil so that water won’t leak out under the tube’s rim. (An adult should complete this step for younger students.)
sketches showing a tube being hammered into the soil then filled with water.

Part 2: Measure Infiltration

Once you’ve set up the infiltrometer, you are ready to continue with the soil infiltration activity and collect your measurements.

  1. Pour water into the infiltrometer.
  2. Note the starting height of the water and start the stopwatch.
  3. Watch the water level in the infiltrometer lower as the water seeps into the soil.
  4. Repeatedly record the water level over time on the student worksheet.
  5. Repeat in different soils – compare a sandy soil, flowerbeds, mulch, gravel, sand, compost, etc.

Post-Lab

For an extra math challenge: Calculate the infiltration rate for each of the soils:

You may also wish to ask your students to reflect on their predictions. Were their predictions correct? Which soil had the highest infiltration rate? The lowest? What might cause this?

What’s Next?

Once you’ve measured infiltration, why not measure other water cycle processes? Be sure to check out my blog post explaining how to measure evaporation and my post on making a DIY rain gauge to measure precipitation with your students!

Materials for Teaching Infiltration and the Water Cycle

Save time preparing for this activity! My Water Cycle Unit includes printable directions and worksheets for this activity and two other water cycle activities. Plus flashcards, diagrams, and more. Check it out:

photo of at home science lab activity handouts and worksheets

Explore more lessons from Wild Earth Lab:

If you enjoyed this post, I know you will love trying my other printable science and nature units in your classroom too!


Are you interested in reading more posts with science activity ideas? Don’t forget to subscribe or follow Wild Earth Lab using the links below!


Subscribe, share, and comment:

Posted on — Leave a comment

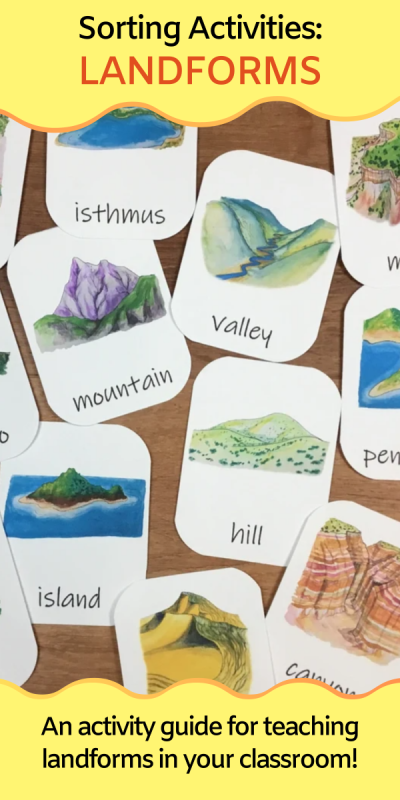
Teaching Landforms: sorting and compare & contrast activities

landform flashcards
text that says share this post

Teaching landforms in your classroom? If you’re searching for a quick and easy way to help students learn about landforms—without needing lots of extra supplies—you’ve come to the right place! This post shares simple sorting and compare/contrast activities perfect for introducing landforms. All you’ll need are some landform flashcards or pictures, making this activity both fun and hassle-free!

Materials

All you need for this simple learning activity is some good landform flashcards or pictures. I recommend downloading and printing my landform three-part cards. Optionally, you can also purchase my water features three-part cards. You’ll receive high-quality illustrations of each landform on printable flashcards, plus you’ll support my blog with your purchase!

landforms flashcards

Or, if you’re looking for EVEN MORE landforms materials for your lessons, I recommend checking out my complete Landforms Unit. It includes the landforms flashcards, a printable version of the directions in this blog post, and additional activities and printable materials.

Step 1: Get to know the common landforms

Using your landform flashcards, work through the following steps with your students to introduce the common landforms.

  • Look through the whole-card flashcards together.
  • Read the definitions on the information cards and learn about how each common landform is formed.
  • Practice matching landform pictures to landform names with the picture-only and word-only flashcards.
  • Can you spot any of these landforms on the coastal and desert landscape posters?

Landform Sorting Activities

Arrange the flashcards into different groups:

  • Landforms that are surrounded by water and landforms that are not surrounded by water.
  • Landforms made of loose sand or soil and landforms made of solid rocks.
  • Landforms that stick up out of the earth and landforms that go down into the earth.

Which landforms…

Which landforms…

  • Are flat on top?
  • Are pointy?
  • Are steep?
  • Are gently sloping?
  • Are hollow inside?
  • Can be found in your local area?

Compare and Contrast

Look for some similarities and differences between each pair of landforms:

  • Island and peninsula
  • Peninsula and isthmus
  • Mountain and volcano
  • Mountain and hill
  • Hill and sand dune
  • Valley and canyon
  • Cave and volcano
  • Mesa and mountain
  • Cliff and canyon

How did it form? (advanced!)

  Find the cards for the landforms that are formed by:

  • Erosion
  • Deposition
  • Volcanic activity
  • Plate tectonics

(Hint: some landforms can form in more than one way and may fit into more than one category)

What’s Next?

Continue reading about the different types of landforms (complete with examples of each type!) You can also read my post about water features.

Study this topic with Wild Earth Lab!

There’s no need to scramble to put together the perfect landforms lesson  – I’ve already created it for you! This set includes all the printable materials you need for studying landforms in your classroom or homeschool!

Explore more lessons from Wild Earth Lab:

If you enjoyed this post, I know you will love trying my other printable science and nature units in your classroom too!


Are you interested in reading more posts about educational activities? Subscribe or follow Wild Earth Lab using the links below!


Subscribe, share, and comment:

Posted on — Leave a comment

DIY Rain Gauge Activity for Teaching the Water Cycle

plastic bottles and scissors on a classroom desk
text that says share this post

Teaching your students about the water cycle? Building a DIY rain gauge from a plastic bottle is a fun, hands-on activity to explore a key water cycle process: precipitation. This simple project is perfect for your classroom or homeschool and can be a stand-alone lesson or part of a larger study of water cycle processes.

Before we dive in: The activity from this post comes from my complete Water Cycle Unit. If you’re an educator planning to teach precipitation and the water cycle, you’ll find printable directions, worksheets, and much more in the Water Cycle Unit (plus you’ll support my blog with your purchase! ❤️)

Materials

Gather the following materials to complete this activity:

  • 2 empty plastic soda bottles of the same size
  • Scissors
  • Ruler
  • Permanent marker
  • Student worksheets & printable directions (available in my Water Cycle Unit!)
A photo showing classroom handouts for teaching students how to build a precipitation gauge

Measuring Precipitation: Step-by-Step Directions

The basic idea of this lab is that you will build your own rain gauges out of plastic soda bottles and then use them to collect and measure precipitation in two places. Assist your students as they work through the following steps.

Pre-Lab

In this lab, students will compare the precipitation measured in at least two different locations. For example, they could compare an area with trees and an area out in the open. Or they could give one rain gauge to a friend on the opposite side of town.

Before starting the lab activity, ask your students to make some predictions and explain their reasoning. Which location will receive more precipitation? Or will both locations receive the same amount? Explain your reasoning.

Part 1: Make Your Precipitation Gauge

You will need to build your precipitation gauges and then wait several days to collect your results. First, here’s how to make your own precipitation gauges from plastic bottles:

  1. Cut the plastic soda bottles in half below the tapered necks (an adult should do this step for younger children).
  2. Turn the bottlenecks upside down to make funnels.
  3. Use a ruler and permanent marker to make measurement markings (e.g., centimeters or inches) up the side of the bottle, starting from the bottom.
images depicting cutting a bottle in half then using the top half to make a funnel into the bottom half

Part 2: Measure Precipitation

Several days later, complete the experiment:

  1. Place each precipitation gauge outside. You may wish to stack rocks around the gauges to keep them from tipping over.
  2. Compare the precipitation in two locations. Try placing one precipitation gauge somewhere with trees and one out in the open. Or give one gauge to a friend or family member who lives nearby.
  3. In winter, if you have snow, remove the funnel from the top of each gauge bottle to allow snow to fall directly into the base of the bottle. Bring the gauge inside to allow the collected snow to melt to measure snow water equivalent.

Post-Lab

For an extra math challenge: Measure the diameter (D) of the precipitation gauge and then calculate the volume of water that you collected in each rain gauge using the volume of a cylinder equation:

volume of a cylinder equations

You may also wish to ask your students to reflect on their predictions. Were their predictions correct? Which location received more precipitation? What mechanism might have caused this?

What’s Next?

Once you’ve measured precipitation, why not measure other water cycle processes? Be sure to check out my blog post explaining how to measure stream flow with your students and how to measure evaporation!

Materials for Teaching Precipitation and the Water Cycle

Save time preparing for this activity! My Water Cycle Unit includes printable directions and worksheets for this activity and two other water cycle activities. Plus flashcards, diagrams, and more. Check it out:

photo of at home science lab activity handouts and worksheets

Explore more lessons from Wild Earth Lab:

If you enjoyed this post, I know you will love trying my other printable science and nature units in your classroom too!


Are you interested in reading more posts with science activity ideas? Subscribe or follow Wild Earth Lab using the links below!


Subscribe, share, and comment:

Posted on — Leave a comment

Hands-On Water Cycle Activity: Measure Evaporation

Jars with blue water
text that says share this post

Looking for a simple, hands-on way to teach the water cycle? Measuring evaporation is an easy activity that brings the process to life for your students. Perfect for classrooms or homeschools, this experiment makes learning about the water cycle engaging and interactive! You can measure evaporation as a stand-alone activity or as part of a larger exploration of water cycle processes.

Before we dive in: The activity from this post comes from my complete Water Cycle Unit. If you’re an educator planning to teach evaporation and the water cycle, you’ll find printable directions, worksheets, and much more in the Water Cycle Unit (plus you’ll support my blog with your purchase! ❤️)

Materials

Gather the following materials to complete this activity:

  • Two small see-through jars or cups
  • Liquid measuring cup (or graduated cylinder)
  • Water
  • Food coloring
  • Permanent marker
  • Student worksheets & printable directions (available in my Water Cycle Unit!)
A photo showing classroom handouts for teaching evaporation lab activities

Measuring Evaporation: Step-by-Step Directions

The basic idea of this lab is that you will have two jars, one with a lid and one without. You will observe the change in the water level in the two jars over several days due to evaporation. Assist your students as they work through the following steps.

Pre-Lab

Before starting the lab activity, ask your students to make some predictions and explain their reasoning.

Will the jar with the lid:

  • Loose water?
  • Gain water?
  • Remain the same?

Will the jar without a lid:

  • Loose water?
  • Gain water?
  • Remain the same?

Part 1: Set Up

You will need to set up the experiment and then wait several days to collect your results. On the first day, take the following steps:

  1. Use a liquid measuring cup to measure equal amounts of water into two small glass jars.
  2. Put a drop of food coloring in each jar.
  3. Use the marker to mark the water level in each jar.
  4. Leave one jar open. Put a lid on the other jar – this will be your control. Discuss with your classmates and/or instructor the purpose of a control in a science experiment.
  5. Place the jars under a covered area so rain can’t fall into them. Wait several days or weeks. Evaporation may occur very slowly in humid climates.

Part 2: Measure Evaporation

Several days later, complete the experiment:

  1. Once the water level is visibly lower in the open jar, use the graduated cylinder or liquid measuring cup to measure the amount of water in each jar. Record the volume on the student worksheet.
  2. The difference between the two jars is the amount of water that evaporated.
  3. Discuss whether water evaporated from each jar – why or why not?

Post-Lab

Ask your students to reflect on their predictions. Were their predictions correct? Why or why not? Which jar lost water? What caused it to lose water?

What’s Next?

Are your students up for a bigger challenge? Now that you’ve observed evaporation, why not measure some other water cycle processes? Be sure to check out my blog post explaining how to measure stream flow with your students and how to measure snow!

Materials for Teaching Evaporation and the Water Cycle

Save time preparing for this activity! My Water Cycle Unit includes printable directions and worksheets for this activity and two other water cycle activities. Plus flashcards, diagrams, and more. Check it out:

photo of at home science lab activity handouts and worksheets

Explore more lessons from Wild Earth Lab:

If you enjoyed this post, I know you will love trying my other printable science and nature units in your classroom too!


Are you interested in reading more posts with science activity ideas? Subscribe or follow Wild Earth Lab using the links below!


Subscribe, share, and comment:

Posted on — Leave a comment

5 Reasons to Teach Soil Science in Your Classroom

Children gathered around a hole dug in the soil
text that says share this post

Soil is often overlooked as a classroom topic, yet it’s a fascinating and practical area of science to explore with one’s students. Whether you’re introducing elementary schoolers to the basics of earth science or tackling advanced environmental science concepts with high schoolers, soil science offers countless opportunities for hands-on learning with real-world applications. Here are five compelling reasons to incorporate soil science into your classroom curriculum.

But first: if you’re already on the hunt for great soil science teaching materials, I think you and your students will love my complete soil science unit. It includes directions for five soil lab activities, worksheets, readings, and engaging diagrams. Plus you’ll support this blog with your purchase!

1. Soil Science is an Interdisciplinary STEM Subject

One of the most exciting things about teaching soil science is its interdisciplinary nature. It bridges various STEM (Science, Technology, Engineering, and Math) fields, letting your students experience how scientific disciplines interconnect. For example, students will use math to calculate soil porosity and permeability and apply chemistry to analyze pH levels and organic matter content. Biology comes into play when learning about soil microorganisms! And even physics will come up when looking at how water moves through different soils.

Teaching soil science allows you to create lessons that naturally integrate multiple disciplines. For instance, you might try a lab where students add water to sandy and silty soils, calculate porosity, and graph their results. You can read my blog post about how to calculate porosity in your classroom! Activities like this, while simple, reinforce STEM skills!

a lab bench with a clipboard, some soil in dishes, and a bottle of liquid
A soil organic matter lab activity. Find directions online or printable versions.

2. Soils Impact Our Food, Water, Climate, and Ecosystems

Soil is so much more than just dirt! Soil is necessary for food production, water filtration, carbon storage, and ecosystem health. Teaching students about soil helps them understand the connections between soil and global challenges like food security and climate change.

For example, healthy soils are necessary to grow crops that feed Earth’s growing population. Soils also act as natural filters, purifying water as it percolates through its layers. Furthermore, soils tie into ecosystems and the climate, since they store carbon and other nutrients. Studying soil science is a great way to begin a discussion on sustainability and environmental conservation with your students.

3. Soil is Great for Hands-on Activities!

When you teach soil science, you’ll have the chance to try many hands-on learning activities with your students. For example, you could analyze soil textures – for example, by doing the soil textures “jar lab” I wrote previously about in my blog. The basic idea is this: students mix soil samples with water, shake them, and let the particles settle into layers of sand, silt, and clay. The larger, heavier particles settle out first, which lets your students observe the amount of sand, silt, and clay in the soil. This simple experiment visually demonstrates the concept of soil texture and allows students to connect theoretical knowledge with real-world observations.

Another activity is testing soils’ organic matter content. This activity relies on chemistry: when applied to soil, hydrogen peroxide reacts with organic matter, causing bubbling and fizzing. If you’d like to try this activity, you can find step-by-step directions in my blog post about detecting soil organic matter with hydrogen peroxide.

Truly, there’s no shortage of soil science experiments and activities to try. Additional options could include measuring soil pH levels and growing plants in different soil types to observe how soil composition impacts growth. These hands-on labs make lessons more interactive and also teach science skills like hypothesis testing and data collection.

a jar with soil and water and a stopwatch on a table next to handouts and worksheets
A soil textures jar lab. Find the directions online or printable versions.

4. Soil Knowledge is Useful in Many Career Paths

A little soil science knowledge goes a long way for students who dream of working outdoors or making a difference in the environment. Professions in agriculture, conservation, environmental science, land management, and urban planning all require a deep understanding of soil. Additionally, careers in engineering, hydrology, and ecology often intersect with soil science, offering even more opportunities for students with this foundational knowledge.

Introducing soil science in the classroom helps students see how their lessons could lead to fulfilling careers. You can highlight professionals who work in these fields, invite guest speakers, or assign projects where students explore soil-related careers. These activities provide opportunities to explore a variety of career paths for students who may not yet see how their classroom studies relate to their future goals.

corn plant on field
Soil knowledge is key in many careers, including agriculture. Photo by Flambo on Pexels.com

5. Soil Science Gets Students Outside

Another great reason to teach soil science is the opportunity to take your class outdoors. No matter where you live, there’s soil to explore! Outdoor activities like digging into a local soil horizon, observing soil erosion, or starting a classroom composting project can help students apply their classroom knowledge to real-world observations.

Fieldwork can be as simple or elaborate as you want it to be. You might organize a short walk around your school grounds to collect soil samples or partner with a local park for a more in-depth study. Outdoor experiences are sure to enrich your soil lessons. Plus, they’re a great way to encourage physical activity and break up the monotony of a traditional classroom setting.

Teaching Soil Science in Your Classroom

If you’re an educator planning to teach soil science, great learning resources are key to deepening understanding! I think you and your students will love my complete Soil Science Unit (plus you’ll support my blog with your purchase!)

Explore more lessons from Wild Earth Lab:

If you enjoyed this post, I know you will love trying my other printable science and nature units in your classroom too!


Are you interested in reading more posts like this? Subscribe or follow Wild Earth Lab using the links below!


Subscribe, share, and comment:

Posted on — Leave a comment

Teaching Climate Change: Positive Feedback Loops & Sea Ice

positive feedback loop diagram

Are you searching for a science lesson that brings climate change to life in your classroom? Positive feedback loops explain the relationship between sea ice, albedo, and temperature— and teaching them is a powerful way to help students grasp the dynamics behind our warming planet. By teaching positive feedback loops, you’ll equip your students with a deeper understanding of one of the mechanisms fueling anthropogenic climate change. Let’s explore this complex topic so you can plan an impactful and accessible lesson for your learners.

Before we dive in: If you’re an educator planning to teach positive feedback loops and climate change, having great visuals to deepen understanding is key. That is why I created this positive feedback loop diagram set to help you and your learners study this topic.

What is a Positive Feedback Loop?

In science, a positive feedback loop is a cycle that reinforces or amplifies itself. A simple example is when laughter spreads. If your friend starts laughing, it might make you laugh too, which then makes your friend laugh even harder. This cycle continues, making everyone laugh more.

A positive feedback loop is called “positive” because each part of the cycle strengthens the next, not because it is necessarily a good thing. For example, a forest fire can create a positive feedback loop. As more trees catch fire, the fire gets bigger and hotter, which makes it easier for the flames to spread to even more trees.

Climate change gets amplified by positive feedback loops too. To understand how this works, we first must understand a little more about a reflective property called albedo…

What is Albedo?

Have you ever noticed that a black T-shirt feels hotter than a white T-shirt on a sunny day? When sunlight hits a surface, some energy reflects off while the rest is absorbed, making the surface warmer. Albedo is a measure of how much sunlight a surface reflects. Light-colored or shiny surfaces usually have a high albedo, meaning they reflect more sunlight. Dark surfaces, like a black T-shirt, have a lower albedo, so they absorb more energy from the sun and feel warmer.

Positive feedback loops play a role in climate change, and it begins with albedo. Sea ice in polar regions is light-colored and reflective, so it has a higher albedo than dark ocean water. When temperatures rise, sea ice melts, and the reflective ice is replaced by dark ocean water. The dark ocean absorbs more heat from the sun without the reflective ice to cover it. This causes the ocean to warm more and faster, which increases temperatures and speeds up climate change. As more sea ice melts, it creates a cycle that leads to even more melting.

Side note: if you’re a teacher looking for a hands-on way to demonstrate albedo, read my blog post with a step-by-step guide to an albedo and sea ice experiment for the classroom!

iceberg

A Positive Feedback Loop and Climate Change

Let’s break down a positive feedback loop step-by-step:

1. Temperatures Rise

Average global temperatures are rising. This is an effect of anthropogenic (human-caused) climate change.

2. Sea Ice Melts

Ice melts at 32°F (0°C). When the average global temperature rises, more sea ice melts.

3. The Ocean’s Surface Becomes Exposed

As sea ice melts, the ocean surface is exposed. Large areas that were once covered by light-colored ice are now dark ocean water.

4. Albedo Decreases

Light-colored sea ice reflects more sunlight than dark ocean water. When sea ice melts, the ocean reflects less sunlight.

yellow arrows from the sun bouncing off of ice but not water

5. Ocean Water Warms

Without reflective sea ice, the ocean’s water absorbs energy from the sun. This causes the ocean to warm up. The warming ocean temperatures drive more sea ice to melt, driving the positive feedback loop.

Why it Matters

Why should you care about ice melting in faraway places like the poles? Polar ice melting is a problem for several reasons. First, as ice melts, it raises sea levels around the world. This leads to flooding along coastlines, putting coastal and island communities at risk of disappearing underwater and displacing the people living there. Another issue is the loss of important habitats for animals in the Arctic and Antarctica.

Additionally, as polar regions warm, permafrost (frozen ground) also thaws, releasing greenhouse gases and contributing to further climate change. This is a second example of a positive feedback loop in climate change because more warming causes more gases to be released, which causes more warming.

Teach Positive Feedback Loops and Climate Change:

There’s no need to scramble to pull together materials for a positive feedback loop lesson – I’ve already created them for you! Support this blog when you purchase my Positive Feedback Loop Diagrams and my Albedo Lab Activity materials:

Upgrade Option: both of these sets are also found within my complete Antarctica Unit:

Explore lessons from Wild Earth Lab:

If you enjoyed this post, I know you will love trying my other science and nature units in your classroom too!


Are you interested in reading more posts about fascinating science topics to teach in your classroom? Subscribe or follow Wild Earth Lab using the links below!

Subscribe, share, and comment:

Posted on — Leave a comment

Teaching Climate Change: hands-on sea ice albedo experiment

Albedo lab materials - tubs with water and foil

Are you looking for a hands-on activity to teach climate change? In this lab activity, students will create a model of sea ice and ocean water albedo using aluminum foil and two tubs of water. Students will track the temperature in a covered and uncovered tub on a sunny day. Students will learn about albedo and the impacts of positive feedback loops in climate change.

Important: I’ve made the directions for this albedo lab activity available for free here in this post. If you would like printable directions and worksheets for this activity, you can purchase them in my Albedo Lab mini-study. These materials are also included within my complete Antarctica Unit and Polar Bundle.

Printable directions for the albedo lab activity are available in my mini-study.

Materials

Each lab group will need the following materials:

  • Two clear-bottomed shallow plastic tubs of equal size
  • Cold liquid water
  • A large piece of dark blue or black paper or cloth
  • Aluminum foil
  • 2 thermometers
  • Printed student handouts and worksheets
Student worksheets for the albedo lab activity.

Tips for Success

  • Complete this lab on a sunny, warm day close to mid-day when the sun is overhead. This lab may not work on cold or overcast days, or in the early morning or afternoon when the sun is at a lower angle in the sky.
  • Students should record the water temperature in the two tubs at a 5-minute interval. If the water is warming slowly, you can instruct students to switch to a 10-minute interval.
  • Once students see a clear trend or pattern, you may instruct them to stop taking measurements.
two tubs of water, one covered in foil

Activity Structure and Emphasizing Key Concepts

  • Before starting the lab, ask your students if they would feel cooler wearing a black or white shirt on a sunny day. Or, ask them if they would be more comfortable standing barefoot on blacktop or grass on a hot day.
  • During the lab, introduce the term “albedo” to your students – the amount of solar radiation reflected by a surface. Relate this to the black vs white shirt example and the blacktop vs grass example.
  • After completing the lab procedure, ask your students what they think happens to ocean water at the poles when it is no longer covered in sea ice. Discuss how positive feedback loops work.
positive feedback loop diagram
I created this positive feedback loop diagram for you. It’s available in my shop, and you can support my blog with your purchase!

Step-by-Step Procedure

Head out to a sunny area, pass out the materials, then help your students work through the following steps:

  1. Fill the two clear plastic tubs with equal amounts of cold liquid water.
  2. Check the starting temperature of the water in both tubs. Record the temperatures on the worksheet. The starting temperature should be the same in both tubs.
  3. Fully cover one tub in aluminum foil. This tub represents ocean water covered in a layer of reflective sea ice. The other tub represents uncovered ocean water.
  4. Lay your dark fabric on the ground or table outside in direct sunlight. The dark fabric represents the dark color of ocean water.
  5. Position your tubs on top of the dark fabric in direct sunlight.
  6. Wait 5 minutes.
  7. Check the temperature in both tubs, by inserting the thermometer into the water at the center of the container. Poke a small hole through the foil to insert the thermometer when you check the temperature in the foil-covered tub. Record the temperatures on your worksheet.
  8. Continue to check and record the temperatures every 5 minutes.
  9. Which tub is warming faster? Discuss why.

Discussion Questions

After working through the lab procedure, have your students discuss the following questions in small groups or as a whole class.

  1. Which tub became warmer faster? Explain why.
  2. Which would get warm faster, ocean water covered in reflective sea ice or exposed ocean water? Explain why.
  3. What is albedo? *in your own words
  4. What is a positive feedback loop? *in your own words
  5. In your own words, describe a positive feedback loop involving melting sea ice and climate change.

Worksheets and Printable Directions

There’s no need to put together worksheets and handouts for this lab – I’ve already created them for you! You can purchase them in my Albedo Lab Mini Study. These materials are also found within my complete Antarctica Unit and Polar Bundle.

The albedo lab materials are also found within these products:

Explore more units from Wild Earth Lab:

If you enjoyed this post, I know you will love trying my other science and nature units in your classroom too!


Are you interested in reading more posts with science activity ideas? Subscribe or follow Wild Earth Lab using the links below!


Subscribe, share, and comment:

Posted on — Leave a comment

Rock ID Lab: directions and materials list for a classroom geology activity

a box of rock samples

In this activity, students will become familiar with rocks’ physical properties and the basics of rock identification. Students will sort rocks into groups based on their observations and learn about the physical properties of rocks. At the end of the rock ID lab, students can try identifying rocks by type, subtype, and name.

No prior rock ID experience is needed for students to complete this lab activity. Part A especially is a great way for beginners to explore the physical properties of rocks! However, before beginning parts B and C of this activity, students should already be familiar with the rock cycle and the three main types of rocks (igneous, sedimentary, and metamorphic!) and their sub-types.

Before starting the lab, students should also know the difference between rocks and minerals. Often, it makes sense to do a mineral lab before diving into a rocks ID lab. You can find my mineral lab online write up (free) or the printable directions (for purchase).

Please Note: I’ve made the directions for this rock ID lab activity available for free here in this post. However, if you want printable directions, worksheets, flashcards, readings, and teaching posters for a rock ID lab, you can purchase them in my shop. The printable rock ID flashcards are included but also sold individually. Or, you can find all these materials plus more in my complete Rocks and Minerals Unit.

Materials

This activity requires one of each item per lab group unless stated otherwise.

  • 10+ rock  samples labeled with numbers 1-10+
    • Recommended: granite, gabbro, rhyolite, basalt, limestone, conglomerate, mudstone, gneiss, slate, and marble
    • You can complete this lab with a different rock sample set, but it is ideal to have a mixture of common igneous, sedimentary, and metamorphic rocks.
  • Hand lens or microscope
  • Juice of a lemon
  • Eye dropper
  • Student worksheets (1 set per student)
  • Teaching posters
  • Rock cards
Save preparation time AND support my blog: purchase all the printable materials you need to complete a rock ID lab in my shop!

Modifications (optional)

  • To make this rock ID lab simpler, do parts B and C all together as a class.
  • As an alternative to parts B and C, you could tell students which rocks are igneous, sedimentary, and metamorphic and then ask students to find some similarities between the rocks within each group.
  • To simplify part C, tell your students which 10 rock samples they have, but do not tell them which is which. This allows students to use the process of elimination to identify the most difficult samples.

Safety Notes

  • Read and comply with any warnings on the packaging and safety information sheets of rock samples and test kit tools used to complete this lab.
  • Adult supervision is required at all times while completing this lab.

Directions

Part A: Examine the Rocks

  1. Allow the students to familiarize themselves with the rock samples by picking them up, looking at them, etc…
  2. Ask the students to take note of which rock samples…
    • Are light colored?
    • Are dark colored?
    • Have several different colors?
    • Are one solid color?
    • Are made of crystals? (use hand-lens or microscope)
    • Are made of sediment particles stuck together? (use hand-lens or microscope)
    • Are fine-grained?
    • Sparkle?
    • Are dull?
    • Are soft or break or crumble easily?
    • Are very solid and don’t break or crumble?
    • Have stripes or layers? (foliation)
    • React to an acid (lemon juice)?
      • Note for acid reactions: rocks with a very high calcium carbonate content (e.g., marble, limestone, and coquina) should react with a drop or two of acidic lemon juice. They will bubble and fizz. Rocks with a lower calcium carbonate content (e.g., some mudstones) may bubble and fizz slightly.
Need worksheets and handouts? Purchase my set of printable materials that complement this activity!

Part B: Rock Types & Sub-Types

  1. As a class, review or research the properties of igneous, sedimentary, and metamorphic rocks and their sub-types. Create a list of the properties (texture, composition, foliation, etc…) you might see in each of these rock types and subtypes:
    • Igneous:
      • Extrusive
      • Intrusive
    • Sedimentary:
      • Chemical
      • Clastic
      • Biochemical and organic
    • Metamorphic:
      • Foliated
      • Nonfoliated
  2. As you create your lists, introduce/review the following concepts: mafic vs felsic, igneous textures, grain sizes, and foliation. For this step, the teaching posters found in my product will be a helpful visual aid.
  3. Students should write detailed descriptions of each rock sample, noting the following physical properties:
    • Texture (use a microscope or hand lens)
    • Composition
    • Luster
    • Color
    • Foliation (use hand lens if needed)
    • Acid reaction (strong reaction, weak reaction, no reaction)
    • Other properties
  4. See if your students can correctly identify the type or subtype of any of the rock samples.
    • Start with rocks that can be most easily identified. For example, a rock with clear foliation can quickly be identified as a metamorphic foliated rock. A rock that is made of sediment particles cemented together can be quickly identified as a sedimentary clastic rock.
    • It is OK if there are some rocks that your students are unsure about. Discuss why they are unsure and if there are any types/sub-types they can rule out. It may not be possible to identify certain rocks in a classroom setting.
  5. After this part of the lab is complete, reveal which rocks were sedimentary, igneous, and metamorphic. You may also lead a discussion on how the physical properties of rocks relate to how they formed. E.g., large crystals form deep underground, foliation forms under directional pressure, etc…
Teaching posters for this Rock ID activity(available for purchase)

Part C: Rock ID

  1. Pass out the rock information flashcards or a different rock ID guide of your choosing.
    • For an added challenge: encourage students to only look at the front (info/text-only) side of the flashcards while making their IDs. The backs of the flashcards include pictures and names of the rocks.
  2. The students should read the properties listed on each flashcard.
  3. Students can compare the rock properties on the flashcards to their written descriptions of each sample.
  4. Students should do their best to match each rock sample to its correct identity.
  5. Rock ID is challenging: assist students if they become stuck.
  6. End the lab by revealing the correct identity of each sample.
My Rock ID cards make identifying common rocks a breeze!

Study Rocks and Minerals with Wild Earth Lab!

Save time by purchasing all the printable materials you need for a rock ID lab! This set includes all the worksheets, teaching posters, flashcards, and handouts you need for completing this rock ID activity:

OR: you can also find all the above materials plus more in my full Rocks and Minerals Unit:

Explore more lessons from Wild Earth Lab:

If you enjoyed this post, I know you will love trying my other science and nature units in your classroom too!


Are you interested in more earth science activity ideas? Subscribe or follow Wild Earth Lab using the links below!


Subscribe, share, and comment: