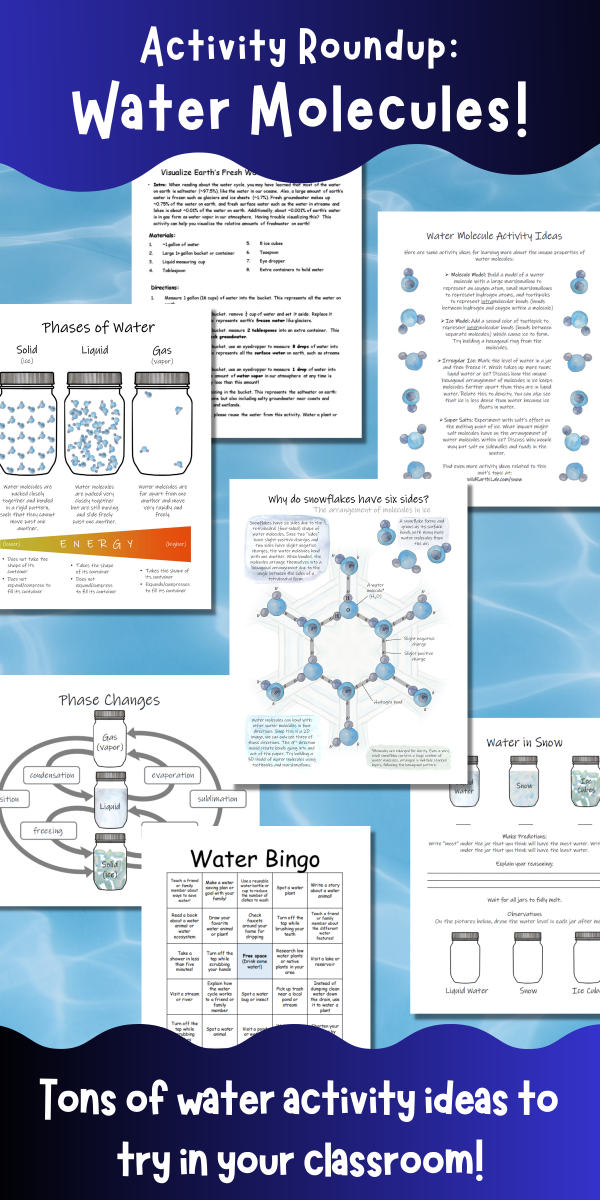
Water. It covers over 70% of the earth’s surface and even makes up about 60% of the human body. But did you know that water has some incredible properties that make it different from other liquids? This is due to water molecules’ unique molecular structure. If you are studying water in your classroom, here are a few fun water molecule activities to help your students “discover” some of water molecules’ weirder properties:
But first, here is a little background info on water molecules. We can think of water molecules as tetrahedral, meaning they behave like a 4-sided shape. Since two “sides” have slight positive charges and two sides have slight negative charges, the water molecules bond with one another. When bonded, the molecules arrange themselves into a hexagonal arrangement due to the angle between the sides of a tetrahedral form.
1. Build a water molecule activity
Build a model of a water molecule with a large marshmallow to represent an oxygen atom, small marshmallows to represent hydrogen atoms, and toothpicks to represent intramolecular bonds (bonds between hydrogen and oxygen within a molecule)
2. Molecular model of ice
After building a water molecule model (see above), continue on to build the hexagonal structure of ice! Add a second color of toothpick to represent intermolecular bonds (bonds between separate molecules) which cause ice to form. Try building a hexagonal ring from the molecules.
3. Volume change: ice vs water
Mark the level of water in a jar and then freeze it. Which takes up more room: liquid water or ice? Discuss how the unique hexagonal arrangement of molecules in ice keeps molecules farther apart than they are in liquid water. Relate this to density. You can also see that ice is less dense than water because ice floats in water.
4. Salt and water – melting point experiment
Experiment with salt’s effect on the melting point of ice. What impact might salt molecules have on the arrangement of water molecules within ice? Discuss why people may put salt on sidewalks and roads in the winter.
Salt impacts the melting and freezing points of water. Photo by Castorly Stock on Pexels.com
5. Study snow with Wild Earth Lab!
If you like these activity ideas, I think you’ll love my Science in the Snow Unit. It’s a complete set of interdisciplinary learning materials to help you teach a fantastic unit on the scientific study of snow and ice for your middle school or high school class. Students will learn about the molecular structure of ice, phase changes, snow water equivalent measurements, snow hydrology, weather stations, and more! Click the link below to learn more!
Surface watermeans any water that pools or flows on parts of the land’s surface, like streamsand ponds. But a lot of water does not stay at the surface – it infiltrates, or seeps into the ground. Groundwater fills the tiny gaps in the soils and rocks below our feet (called pore spaces).
Groundwater & The Water Table
Before we can learn about groundwater-surface water interactions, we must understand the water table. The water table is the level at which the pore spaces are filled entirely with water. The water table is not a flat surface, but rather a three-dimensional surface. Similar to the surface of the land, the water table has higher and lower areas. Parts of the water table are relatively steep while other parts are flatter. Like surface water, groundwater moves and flows, but much more slowly than surface water.
After a rainstorm or during snowmelt, water slowly seeps downward through the unsaturated parts of the soil to reach the water table. Water can also seep into and out of the ground through the bottoms of lakes and ponds and through streambeds!
Think About It…
Have you ever dug a hole in the sand next to an ocean or lake? Maybe if you dug deep enough, you noticed that your hole started filling in with water. This means you reached the water table! Water moves through the pore spaces between grains of sand to fill in the hole with water.
Gaining Streams
Streams are gaining when water is moving from the ground into the stream. If a stream is gaining, the amount of water flowing through the stream (the discharge) will increase as you move downstream.
Examine the stream diagram below. Arrows represent groundwater flow. What does the water table look like around the gaining stream?
A cross section of a gaining stream. Water is moving from the ground into the stream.
Losing Streams
Streams are losing when water is moving from the stream into the ground. If a stream is losing, the amount of water flowing through the stream will decrease as you move downstream. In some cases, losing streams lose all their water into the ground and dry up at a certain point downstream.
Examine the stream diagram below. Arrows represent groundwater flow. What does the water table look like around the losing stream?
A cross section of a losing stream. Water is moving from the stream into the ground.
Other Possibilities
Additionally, some streams are gaining on one side and losing on the other. This is called throughflow. You can remember this because groundwater is basically flowing roughly perpendicular to the direction of streamflow, “through” the stream.
Examine the stream diagram below. Arrows represent groundwater flow. What does the water table look like around the stream with throughflow?
A cross section of a stream with throughflow. The stream is gaining on one side and losing on the other.
Furthermore, some streams may have gaining portions and losing portions. Streams or portions of streams may also be gaining at certain times of the year but losing at other times of the year, depending on different seasonal conditions. This is common in areas with seasonal monsoons or places with winter snowpack that melts in spring. Extended periods of drought can also alter the stream conditions.
Teaching rivers? Then I think you’ll love my Science on the River Unit!
It’s packed with hands-on, applied STEM activities that will get your students outside investigating rivers like a real environmental scientist. Plus, you’ll support Wild Earth Lab with your science unit purchase!
Are you teaching your students about rivers and streams? Taking your own stream measurements is a great way to turn your lesson into a hands-on science adventure. These are real-world techniques used by watershed scientists and hydrologists to study streams and rivers. Furthermore, it’s an interdisciplinary activity that combines math, measurement, and science to answer questions about rivers and streams.
For Educators: Want printable directions, worksheets, and diagrams for this activity? You will find them in my complete Rivers Unit.
Why should we study rivers and streams? Rivers and streams are important pathways in the water cycle, transporting water between different places. People use river water for drinking, household uses, agriculture, energy production, and more. However, people must be careful when using water from rivers because taking too much too quickly can impact other communities and ecosystems downstream. Hydrologists can collect stream measurements to help ensure that we are not using our water resources too quickly or in unsustainable ways.
Rivers are also facing big issues, including the impacts of climate change. Rivers fed by snowmelt and seasonal monsoons are particularly susceptible to the impacts of climate change. Climate change affects the amount of snow that builds up in the winter and the timing of melt and seasonal monsoons. Pollution is another key issue for rivers. As runoff makes its way over the land, it crosses many surfaces such as roadways, lawns, and farm fields. Chemicals and waste from these surfaces are swept up by the running water and become concentrated in streams and rivers, impacting the river ecosystem and creatures that live there. Scientists and water managers work hard to understand and find solutions to the issues that rivers face today and promote healthy streams and rivers.
Measuring river width and depth
Water depth and width are common stream measurements. The depth and width may vary dramatically as you move upstream or downstream along any stream or river. Width expands as a river moves across flat plains and decreases as the river enters narrow valleys and canyons. Additionally, stream depth typically varies as you move from one side of a stream to the other. The deepest part of a stream cross-section, also known as the thalweg, is not always in the middle – it is sometimes off to the side.
My watercolor painting of students measuring stream width and depth.
Cross-sectional area
Depth and width measurements can be used to estimate cross-sectional area in a location of interest on a river. The cross-sectional area is the area of an imaginary flat surface perpendicular to the direction of flow, bounded by the streambed and water’s surface.
Cross-sectional area of a stream
Calculating River Velocity
Velocity is the speed at which the water is flowing. There are many great tools that hydrologists can use to estimate velocity with high precision and accuracy. However, you can estimate a stream’s velocity in a more low-tech way with just a stopwatch and a stick. Simply time a small item as it floats down a measured length of stream. Then divide the float distance by the time it took the stick to float that far to get velocity!
Velocity is important to know for river safety and boating. Velocity is also used to calculate discharge.
How fast are these ducks moving? That’s the stream velocity!
Measuring River Discharge
Discharge tells us about the amount of water flowing through a river. More specifically, discharge is defined as the volume of water that flows through some cross-section of a river, per unit of time. Think of it this way – velocity is a distance per unit time, and discharge is a volume per unit time. A small creek and a huge river that have the same velocity would not have the same discharge. Discharge is a measurement that allows us to see the difference between that small creek and a huge river because it is a volumetric flow rate.
Measuring discharge helps us keep track of water resources for uses like drinking and growing food. Monitoring river discharge over many years allows water managers to predict and prepare for floods and droughts.
How much water flows out of the dam? It’s important to know the discharge!
Field Trip Activity: Calculate stream discharge!
Materials
Tape measure
Meterstick or yardstick
Stopwatch
Small floating item (e.g., a stick)
A net to catch the floating item (optional)
A small, easily-wadable stream
A buddy or two
Worksheets, diagrams, and printable directions for this activity (available in my complete Science on the River Unit)
Part 1: Estimate Velocity
You can estimate a stream’s velocity in a low-tech way with just a stopwatch and a floating object (e.g., a stick). Simply time a small item as it floats down a measured length of stream.
Time a small item as it floats down a length of the river to estimate the water’s velocity. Photo by Mariana Mileeva on Pexels.com
In a small, easily wadable stream, use the tape measure a short float length (5-10 meters, or 15-30 feet) along the bank, parallel to the stream. Use a shorter distance if the stream is flowing very slowly.
At the upstream end of your measured float length, drop a stick or other small floating object into the water. Drop the stick into a part of the stream that is flowing, not into a pool or eddy.
As you drop the stick, start the stopwatch.
Wait for the stick to float the measured float length. You may need to start over at step 3 if the stick becomes stuck.
When the stick reaches the downstream end of your float length, stop the stopwatch. Record the time in seconds. (If the item you are floating is human-made like a paper boat or rubber duck, be sure to retrieve it so that it doesn’t become litter!)
Repeat steps 2 through 5 two more times. Calculate the average time by adding the three times together and dividing that number by 3.
Divide the float length by the average time to find the velocity.
Part 2: Find Discharge
Discharge is the flow of water in a stream. You can calculate discharge by multiplying the velocity of the stream by the approximate cross-sectional area of the stream.
Return to the same place where you measured the velocity in part 1. In this same place, measure the width of your stream. Hold one end of the tape measure and toss the other end across the stream to a partner on the other side of the stream. Record the width from the water’s edge to the water’s edge.
Use a meterstick or yardstick to measure the depth of the stream in three different places along the tape measure spanning the stream. For example, measure the depth near the left side, near the right side, and close to the center of the stream. Take the average of the three depth measurements.
Multiply the average depth by the width to find the approximate cross-sectional area of the stream.
Multiply the cross-sectional area by the velocity (from part 1) to find the discharge.
Note: use the same units for all the numbers when doing calculations. E.g., if your velocity is in feet per second, then be sure to measure width and depth in feet.
Trying the activity with your class?
You’ll find a complete set of printable worksheets, activity guides, and visual aids for this activity and more cool hands-on science activities in my Science on the River Unit! (Plus you’ll support this blog with your purchase – which is pretty cool too😉).
A stream or river is a natural, flowing waterwayon the land’s surface. Stream channels are long, narrow depressions in the land where water flows. There are several common river channel types, also known as the major plan forms.
Before we dive in: If you’re an educator planning to teach about rivers, having great visuals to deepen understanding is key! You can find materials for teaching channel types/plan forms within my comprehensive Science on the River Unit. It also includes activities for measuring stream discharge, lessons on drainage patterns, and stream diagrams (plus you’ll support my blog with your purchase! ❤️)
As a river flows from its headwaters out to the sea, it usually transitions between several different plan forms. The river channel is shaped by the surrounding landscape, underlying rock type(s), sediment availability, andflow regime(i.e., variation in the amount of water flowing through a river, including the magnitude and frequency of different-sized floods).
Different rivers naturally have different plan forms – and that’s a good thing! You will find healthy streams and rivers with various natural planforms – no one planform is necessarily better than the others. It is best for a river to be as close to its natural state as reasonably possible.
The major planforms are straight, meandering, braided, and anastomosing. Next, let’s take a look at the different types of river channels you may see:
Straight River Channels
Straight channels are seen in areas where the landscape is steep, such as on the side of mountains or in straight, narrow valleys. The stream or river’s channel appears mostly straight with few curves or bends.
Straight river channel
Meandering River Channels
A meander is a curve in a stream. Subsequently, a meandering river is curving with many noticeable bends or turns. Meandering channels are seen in areas where the topography is gentle or nearly flat, such as plains and wide valley bottoms. Even subtle changes in the land’s surface can shape the river’s path since water always flows downhill in the path of least resistance. Flow is fastest on the outside of a curve, causing erosion. In contrast, flow is the slowest on the inside of a curve. Sediments settle out of the water and accumulate on the insides of curves, where water flows slowest, forming point bars.
Meandering river channel
Notably, some meanders are curvy and nearly double back on themselves, forming a loop. These extra curvy meanders are called goosenecks. Over time, the fast waters on the outside curves of a gooseneck wear down the banks. Eventually, the curves erode all the way through so that the flowing river water bypasses the gooseneck, cutting off the loop. Then, the former gooseneck becomes a water feature known as an oxbow lake.
Photo by Ian Beckley on Pexels.comThe Oxbow by Thomas Cole is licensed under CC-CC0 1.0Two examples of goosenecks. When the thin neck erodes all the way through, the river bypasses the loop and an oxbow lake forms.
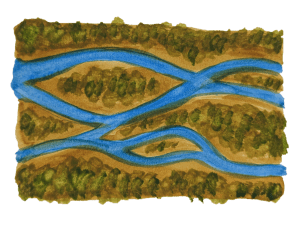
Braided channels are seen in many locations, including deserts, plains, glacial outwash, and coastal areas. The river channel contains sediment bars, giving it a braided appearance. For a braided channel to form, there must be plenty of sediment available in the channel to build up bars. Bars can be made of a variety of sediments: silts and sands, gravels, or larger stones.
The locations and shapes of sediment bars change over time. Although the bars in a braided channel may look permanent, the sediment is slowly making its way downstream toward the ocean. The powerful, flowing water carries each grain of sediment a short distance at a time. In fact, a single piece of sediment may travel a short distance rapidly, then settle onto a bar or the riverbed for days, months, or even years before it moves again. Even so, large floods can cause rapid changes in the locations and appearances of the bars in a braided river.
Braided river channel
Anastomosing River Channels
In an anastomosing channel, multiple river channels are separated by large, vegetated bars or islands. This gives the appearance of a few separate stream channels rather than one main channel. Braided rivers and anastomosing rivers are similar because they both have multiple channels that intertwine. The main difference between anastomosing rivers and braided rivers is that the channels of an anastomosing river are separated by semi-permanent islands, while the sediment bars of a braided river are more ephemeral (short-lived).
Anastomosing river channel
Teaching Rivers in Your Classroom
Are you an educator planning to teach about rivers? You can save time preparing lessons by using my complete Science on the River Unit below. Plus, you’ll support Wild Earth Lab with your purchase!
Rivers and streams provide endless opportunities for scientific exploration and discovery – and chances are you can find one right in your community! From their chemistry and physics to their role in ecosystems and human communities, rivers and streams offer excellent opportunities to teach critical concepts in science and math in an applied way. Across…
It’s hard to imagine just how little freshwater exists on Earth compared to saltwater. If you’re teaching the water cycle, your students might be amazed to learn that less than 3% of the Earth’s water is freshwater—the rest is saltwater. In this post, I’ll show you a hands-on freshwater learning activity that uses simple kitchen…
The water cycle is the process that keeps our planet’s water in constant motion. From evaporation to groundwater flow, each step plays a vital role in shaping our environment and life on our planet. In this post, we’ll explore 10 key processes in the water cycle, breaking down how each one works. For teachers: If you’re…
Are you teaching the water cycle or studying soil in your classroom or homeschool? Measuring infiltration rates in different types of soils is a hands-on activity that helps students explore how water interacts with the ground. This soil infiltration activity also ties in perfectly with studies of porosity and permeability. This engaging experiment works as…
Teaching your students about the water cycle? Building a DIY rain gauge from a plastic bottle is a fun, hands-on activity to explore a key water cycle process: precipitation. This simple project is perfect for your classroom or homeschool and can be a stand-alone lesson or part of a larger study of water cycle processes.…
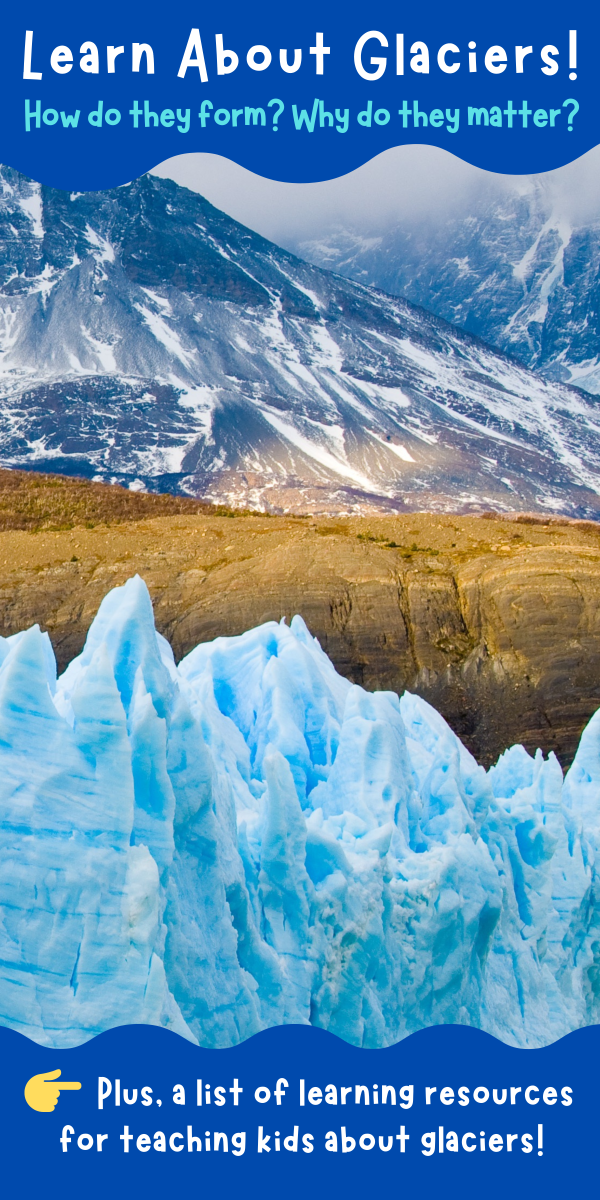
A glacier is a large, dense ice mass made from compacted snow that slowly moves under its own weight over a long period of time. Unlike seasonal snowpack, glacial ice does not fully melt in summer. Although glaciers move slowly, often just centimeters per day, they may cover great distances over many years. There are two types of glaciated landscapes on Earth. Alpine glaciation is found in tall mountains where the high elevation creates cold enough conditions for glaciers to form. Continental glaciation is when glacial ice fully covers a very large area of land – sometimes an entire continent!
A note for teachers: if you’re teaching glaciology, glacial landscapes, ice ages, or climate change, I think you’ll love the hands-on materials and engaging lessons in myGlaciers Unit. It covers all these topics and more, with activities, research projects, models, and high-quality visuals. Plus, you’ll support this blog with your purchase! 💙
Glacial ice begins forming when snowflakes fall and accumulate. Compared to ice, freshly fallen snow has a very low overall water content and is mostly made of air. As snowfall continues, snow compacts under its own weight. The delicate snowflake forms start breaking under the weight of overlying snow. Snowflakes may also recrystallize into more grain-like shapes if they partially thaw and refreeze. These forces reshape the snowflakes into granular snow.
Next, over several winters, additional snowfall buries and compacts the granular snow. Grains become weakly cemented together into firn. There is still air between the individual grains, but less than in granular snow. Over many years, the firn is buried deeper and deeper in snow. The mass of the overlying snow applies great pressure on the firn. This pressure forces more air out and causes the firn to recrystallize into glacial ice.
Glaciers form when the amount of snow that accumulates on the ground in an area is more than the amount of snow that ablates – or is lost. Glacial ice ablates by melting and calving (breaking off into a body of water and floating away). Year after year, as snow builds up, it compacts and recrystallizes into dense glacial ice. An advancing (growing) glacier accumulates more ice than it ablates. A receding (shrinking) glacier accumulates less ice than it ablates. Glaciers also move downhill due to gravity via basal sliding over bedrock and sediments.
Part of an ice sheet in Antarctica
What are the different types of glaciers?
Valley Glaciers
A valley glacier is a large area of ice confined to a mountain valley. As valley glaciers move down valleys, they carve out many unique landforms. As the ice bends to go around corners or over surfaces with changing slopes crevasses, or cracks, form in the surface of the glacier. Today, you will find valley glaciers in many tall mountain ranges worldwide and even in some high-elevation areas close to the equator! However, many valley glaciers are receding due to our warming climate.
Ice Sheets
Ice sheets are huge areas of ice that cover 50,000 square kilometers or more! Unlike valley glaciers, which move in just one direction, ice sheets spread outward in all directions. Ice sheets cover large parts of continents, or sometimes, entire continents. Today, ice sheets are only found in Antarctica and Greenland. However, during the last glacial maximum, ice sheets also covered large parts of North America and Eurasia. Unlike valley glaciers, ice sheets are not contained within valleys. They may span across and cover entire mountain ranges in a thick layer of ice.
Ice Caps
Ice caps are like miniature ice sheets. They are areas of ice that cover less than 50,000 square kilometers but are not confined to mountain valleys. Ice caps are more common than ice sheets today, and are found in many places, including Iceland, the Andes, and the Himalayas.
Other masses of ice
Ice shelves are parts of glaciers that extend outward over the open ocean or sea. They are still attached to land-based glaciers along an edge. Ice shelves and pieces of ice shelves break off (or “calve”), forming icebergs. Icebergs as well as frozen ocean water form sea ice. Some sea ice melts and reforms each year while some lasts year-round. However, anthropogenic climate change reduces the amount of sea ice that makes it through summers.
Glacial ice stores almost 70% of the world’s freshwater! Additionally, rapid anthropogenic (human-caused) climate change causes glaciers to recede at unusually fast rates. This results in sea level rise and harms coastal communities and ecosystems. Glaciers are also important because they shape the landscape. Furthermore, wildlife live on and around glaciers and sea ice (e.g., glacier finches, penguins) and in landscapes shaped by glaciation (e.g., pikas, Dall sheep).
Scientists who study glaciers are called glaciologists. They measure glacial movement and monitor the recession of many glaciers. Glaciologists study and predict the ways our changing climate affects glaciers. Scientists also learn about past climates by drilling deep into glacial ice and studying ice that formed long ago. The ice deep within some very old glaciers comes from snow that fell hundreds of thousands of years ago! Glacial ice acts as a time capsule, preserving frozen water, gas bubbles, and dust/ash from the time it formed. When scientists study ancient ice, they can learn about past temperatures, atmospheric conditions, volcanic eruptions, and more.
Today, you can find alpine glaciation on most continents. However, most glacial ice is found near the poles. In the past, glaciers covered larger areas of land. During the last glacial maximum (the time when the glaciers were largest during the last ice age), ice sheets covered large parts of northern Eurasia and North America.
Teaching a glaciology or glacial landscapes unit?
Check out the Glaciers Unit that I’ve put together! It features tons of my watercolor illustrations of glaciers and the post-glacial landscape! Click below to learn more!
Before diving into definitions and examples of some common water features, let us ask: “What is a water feature?” Water features are any water body or waterway found on the Earth’s surface!
Water features come in a wide variety of shapes and sizes! For example, some water features are lotic (flowing, like a stream), while others are lentic (stagnant, non-flowing, like a pond). Additionally, water features can have freshwater, saltwater, or a combination of the two (such as brackish water found in coastal wetlands and estuaries). Furthermore, many water features are natural, but also sometimes human-made, like reservoirs and canals.
A Special Note For Teachers: if you are an educator planning a water features unit, you’ll find more information about these different types of water features within my water features unit. You can check it out in my shop, where I offer learning materials for a variety of environmental science units.
Water moves between different water features (and into the air, ground, and ice) through the water cycle. The water cycle is an ongoing process moving water from the oceans to the land and back. To start, the sun powers the water cycle, providing energy for water to evaporate. This creates freshwater and makes it possible for water to move from oceans and low areas to higher places. Then, water flows downhill and makes its way back to the ocean. You can also learn about how humans impact the water cycle in my post from last year.
Bays & Gulfs
A bay is a body of salt water along a coast that is partially enclosed by land. The mouth of a bay is the side that is open to a larger body of water like a sea or ocean. Sometimes, a bay may be called a cove. Gulfs are similar to bays but larger.
A delta is a landform of deposited sediments where a river or stream meets the ocean. Sediments settle out of the river water as it flows into the slower-moving ocean or sea. The movement of water through a delta is controlled by the flow of the river.
An estuary is a partially enclosed body of water where a slow-moving river or stream meets the ocean. Notably, estuaries contain mixed freshwater and salt water. The movement of water through estuaries is controlled by waves and tides as well as by the flow of the river.
A lake is a stagnant or non-flowing body of surface water. However, many lakes are fed by small inlet streams. Similarly, ponds are also non-flowing bodies of surface water. However, ponds are shallower and usually smaller than lakes.
Oceans are vast bodies of salt water. Earth’s ocean is a continuous body of water, but geographically we divide it into 4 oceans: the Arctic, Atlantic, Indian, and Pacific. Similarly, seas are smaller areas of salt water, also connected to the ocean. All together, oceans and seas cover about 70% of earth.
View of the Atlantic Ocean, off the coast of North Carolina, USA
Ponds
A pond is a stagnant or non-flowing body of surface water. However, many ponds are fed by small inlet streams. Ponds are shallower and typically smaller than lakes.
Examples of Ponds
Spy Pond, Massachusetts, USA – frozen in winter time!
Small pond in Colorado beneath Vestal and Arrow Peaks.
Springs
A spring is where groundwater naturally flows onto the earth’s surface. Specifically, a spring forms when the water table is at the same or a higher level than the land’s surface. Springs are often found on steep hillsides or in valley bottoms. Springs may form the beginnings of streams and rivers.
A stream is a flowing channel of surface water. Streams may also be called creeks and brooks. Large streams are called rivers. However, the size at which a “creek” or “brook” becomes a “river” varies dramatically between regions. Perennial streams flow year-round. Seasonal and intermittent streams will dry up at certain times of year or when the weather is hotter and drier.
A waterfall is where a stream becomes vertical or nearly vertical. Waterfalls are found in places that streams flow over steep mountainsides and cliffs. Often, deep plunge pools are found at the bottom of waterfalls.
Find these printable handouts, flashcards, and worksheets in my complete Water Bodies Unit
Wetlands
Wetlands are areas of land flooded or saturated with water. Additionally, wetlands are filled with plants that are adapted for life in flooded environments. Furthermore, wetlands may either last year-round or dry up seasonally. Other names for wetlands include bogs, marshes, and swamps.
A wetland during a part of the year with low waters, along the Appalachian Trail
Ditches & Canals
A ditch is a human-made stream, created to transport flowing water from one area to another. Ditches can move floodwater away from an area where it is not wanted or bring water to an area where it is needed. Similarly, Canals are also human-made streams. However, canals are large enough to allow for boats to pass through them.
Examples of Ditches
The Grand Ditch, Colorado, USA – used to divert water from one side of the continental divide to the other!
A small human-made ditch in Fort Collins, Colorado moves water from a reservoir to farm fields.
Reservoirs
A reservoir is a man-made lake or pond, created to store water for later use. Reservoirs are built by damming a river or stream which forces water to pool upstream. Reservoirs supply year-round water in regions where most of the annual precipitation falls during a short period.
Examples of Reservoirs
Lake Mead & the Hoover Dam, USA – very large reservoir & dam
Teach Water Bodies and Landforms with Wild Earth Lab:
Are you planning to teach landforms and water features? You may enjoy the learning materials I’ve created on these topics! All my learning materials feature my artwork! Find them in my shop or click on the links below:
Snow hydrology is the study of snow’s role in the water cycle. Snow hydrologists study snowfall, melting, and everything that happens to snow in between! Many snow hydrologists are interested in the ways snow impacts our water resources. They may use data to make predictions about the water supply.
A note for teachers: if you’re looking for a winter-themed way to teach applied science and math, I’ve created something you will love. My Science in the Snow winter STEM unit includes hands-on activities for learning about the scientific study of snow. It covers the properties of water molecules, phase changes, weather stations, and snow-water equivalent calculations. Plus, every purchase helps support this blog!
Snow plays an important role in the water cycle in many parts of the world. For example, in mountainous regions, snow accumulates (builds up) in the mountains all winter, then rapidly melts in the spring. As a result, the amount of water flowing through streams dramatically increases in the spring and early summer. Water from snow melt is used for drinking, household activities, and growing food crops. Many animals also rely on a yearly cycle of snow accumulation and melt. For example, some fish rely on cold water from snowmelt to keep their habitats cool enough during the hot summer.
One of the most important things snow hydrologists study is the impacts of climate change on snow. They seek to understand and predict the ways the amount of snowfall and the timing of snowmelt are changing in different places. This is an important topic to study because snow helps provide water that humans and many ecosystems rely on.
This diagram, from my Science in the Snow Unit, shows snow’s role and movements within the water cycle, via accumulation, redistribution, and melting.
What do snow hydrologists measure?
Snow hydrologists take lots of measurements. They measure the total amount of snowfall, as well as the density, composition, layering, and temperature of the snowpack. To collect this information, snow hydrologists may perform field research, monitor weather stations, or use remote sensing (e.g., monitoring an area from an aircraft or drone). Many snow hydrologists are interested in how much water snow will provide once it melts. Because of this, they measure or estimate snow water equivalent (SWE). You can think of SWE as the depth of standing water that would be left on the ground if all the snow melted instantaneously. This number can vary a lot. The density of snow has a big impact on the SWE. Estimating SWE accurately is important because it helps us make predictions about our water supply.
A basic method for measuring snow depth
Methods for Snow research:
1.) Field Research
To collect data, snow hydrologists sometimes need to put on skis or snowshoes and go take measurements by hand. Often, snow hydrologists must carry all the equipment they need on their backs or in sleds. They head out to a study area to measure snow depth, dig snow pits to observe layers in the snowpack, collect samples, and more.
2.) Weather Stations
Weather stations are great for taking lots of measurements all winter long. These stations can monitor the total amount of snowfall as well as the density of snow, temperature, wind speed, and more. Weather stations in remote areas are often powered by solar panels. They can repeatedly take measurements throughout the winter without anyone there in-person.
3.) Remote Sensing
Many of the newest methods in snow hydrology fall into the category of remote sensing. Remote sensing is a way of learning about something without making direct contact with it. Remote sensing includes using drones, aircrafts, and satellites to monitor the ground’s surface. Today, snow hydrologists can learn about the location and characteristics of snow with remote sensing. Some scientists are even developing tools for estimating snow water equivalent with remote sensing.
Drones can be used for remote sensing. Photo by David Bartus on Pexels.com
Are you studying the water cycle or snow?
Check out my collection of Environmental Science educational materials:
This review article by Anne W. Nolin explains recent advances in remote sensing of snow. The article has sections explaining different parameters related to snow that remote sensing may help measure.
In this post, you’ll read about the different types of aquatic insects. You’ll learn how to identify the different types and see example images. This post also discusses aquatic insects’ important use as bioindicators in ecosystems.
A Note For Teachers: If you’re an educator planning to teach aquatic insects, great learning resources are key to deepening understanding! I think you and your students will love my aquatic insects mini study, which you can also find within my huge Macroinvertebrates Unit (plus you’ll support my blog with your purchase! ❤️ )
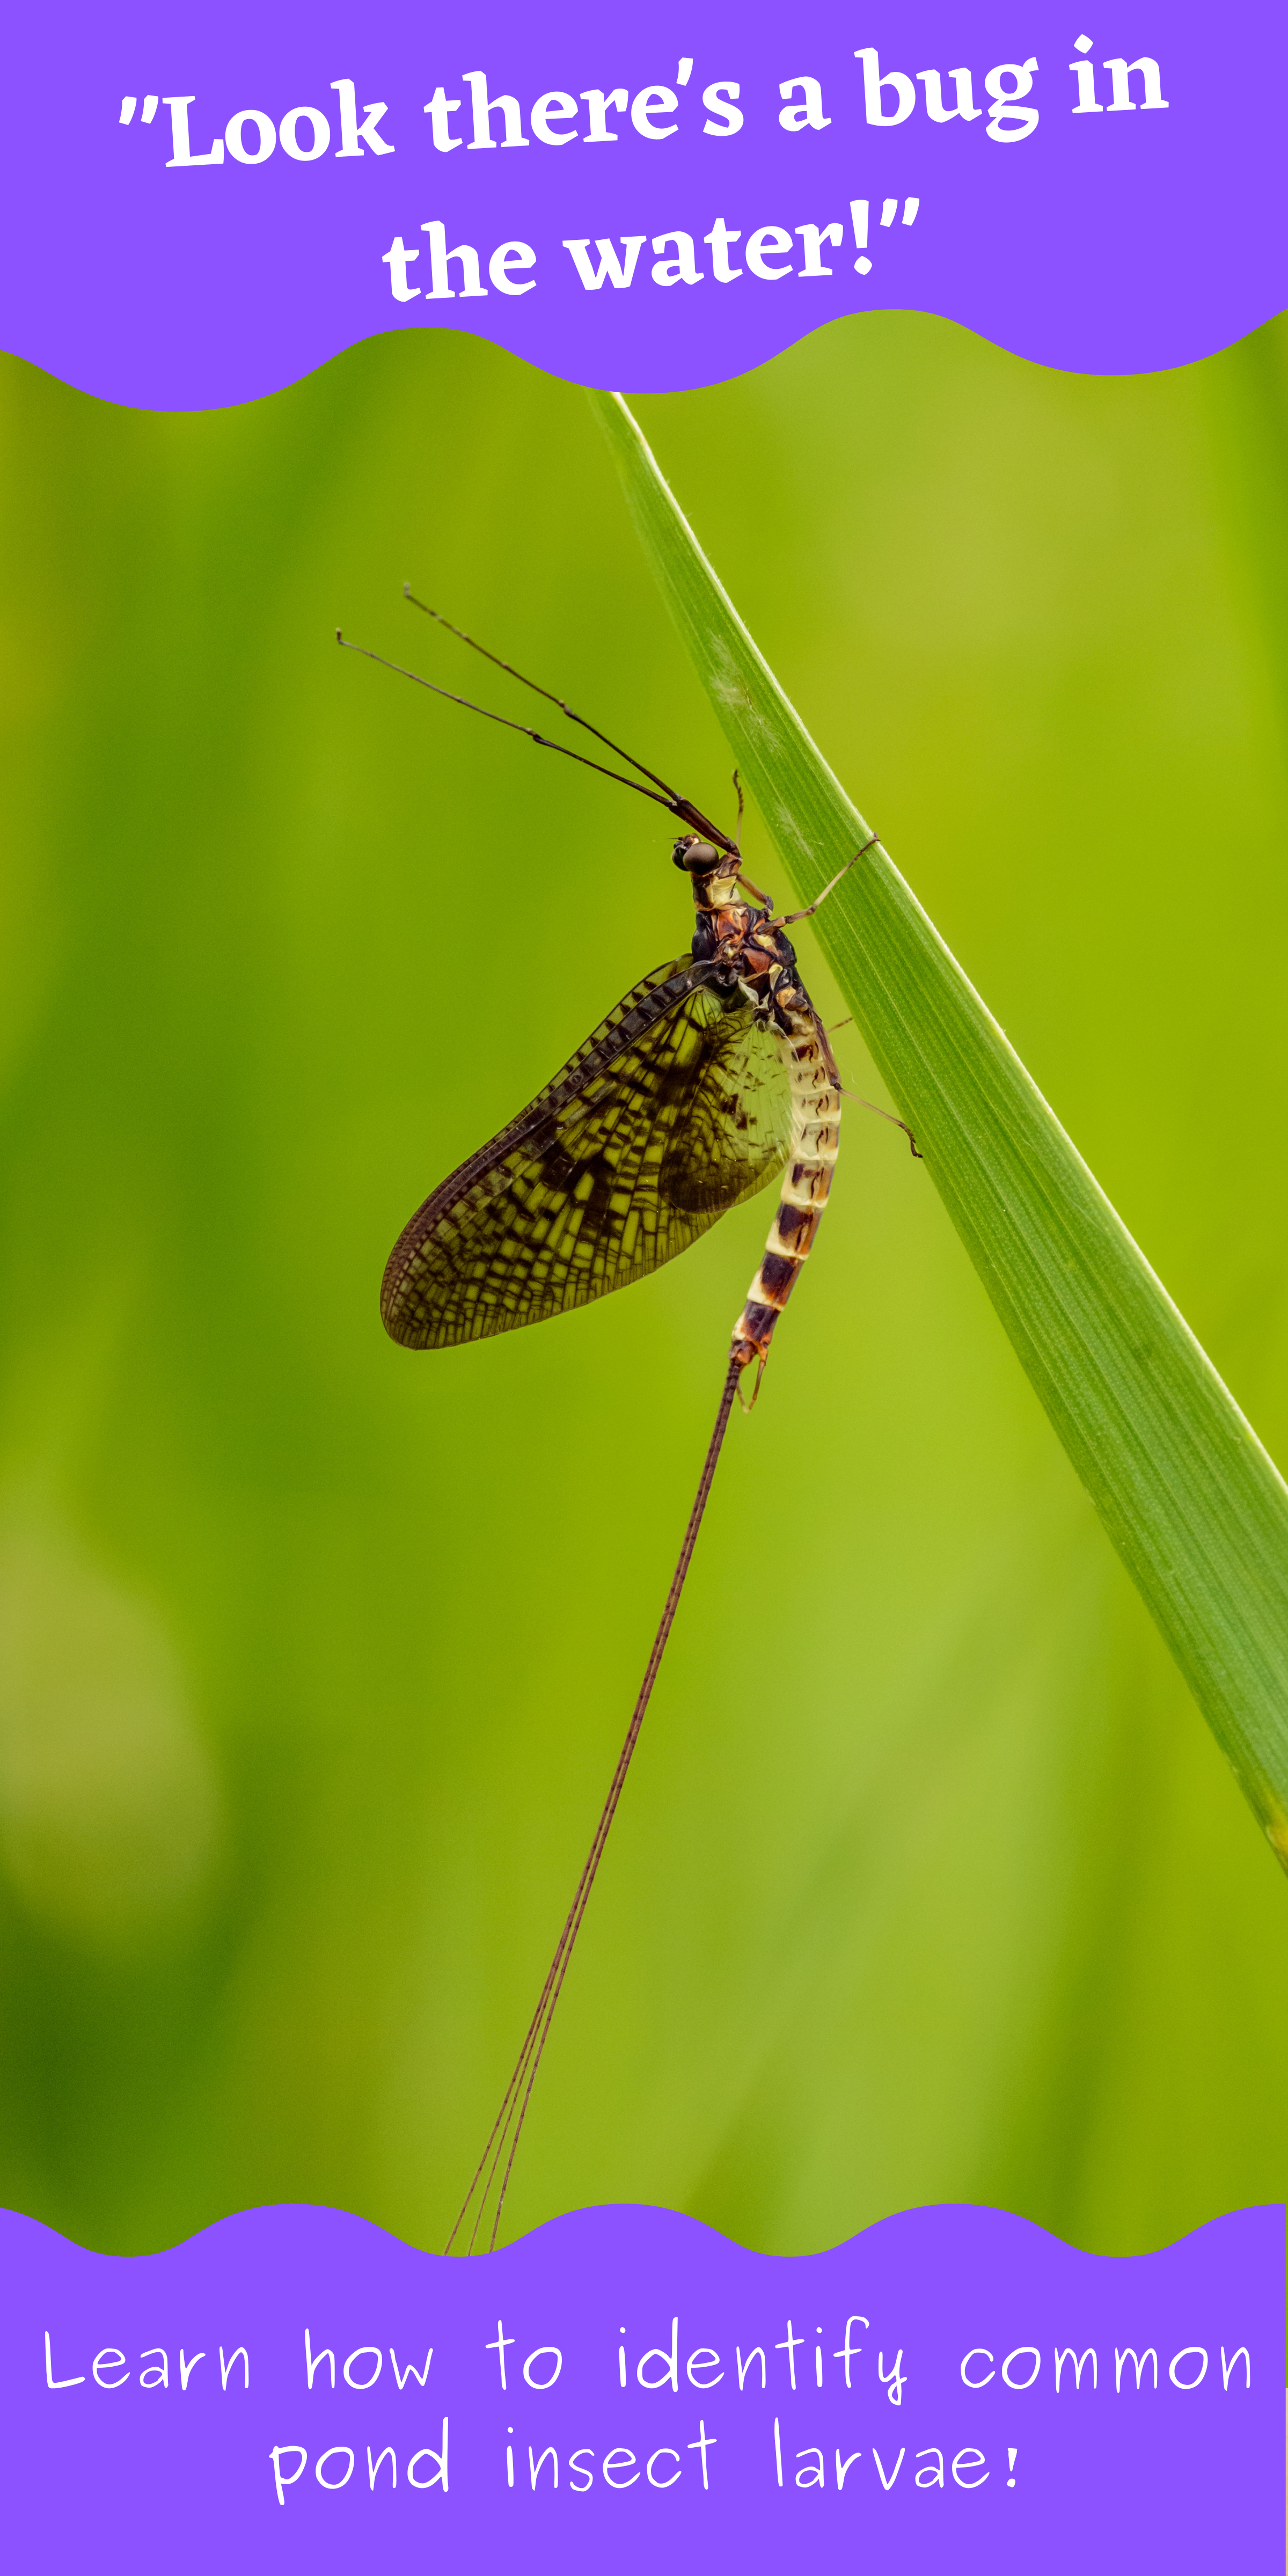
If you flip over a few rocks in the shallow water at any healthy pond or stream, you’re sure to see a few aquatic insects! Many aquatic insects are the larvae or nymphs of well-known flying insects, like dragonflies and mayflies! They begin their lives in the water, then emerge from the surface of the pond or stream as flying adults.
These little creatures play an important role in pond and stream food webs. Aquatic insects help recycle nutrients from the pond’s bottom back into the food web! The juvenile life stages, called either larvae or nymphs, eat algae and waste that settles to the bottom of the water. Many other animals eat aquatic insects. Fish feed on aquatic insect larvae and nymphs living along the pond or stream bed. Some fish will snatch the emerging adult insects from the water’s surface or leap from the water to eat flying adult insects. Birds and amphibians may eat the aquatic insect adults as well.
Aquatic insects can teach us a lot about ecosystems – in other words, they are bioindicators. Some aquatic insects are very sensitive to water pollution. An unhealthy pond or stream ecosystem cannot support a large and diverse population of aquatic insects. Healthy ecosystems should have lots of different aquatic insect species. Scientists use aquatic insects to check in on pond and stream ecosystem health. They will use nets to scoop up samples of aquatic insects from the water. Then, back in a lab, they use microscopes to figure out the different species of aquatic insects that were living there. If you are a teacher or parent, you can try catching aquatic insects with your students/kids too, by following these directions. Usually, more different species means a healthier ecosystem. Here are some examples of aquatic insects and a few tips on how to identify them!
Mayflies
Order: Ephemeroptera
Nymph Identification: Aquatic mayfly nymphs have bodies with distinct head, thorax, and abdomen. They have three pairs of segmented legs, two antennae on their heads, and either two or three long strand-like tails on the ends of their abdomens. There will appear to be two miniature wings on the thorax – these are non-functional “wing pads”. Mayflies and stoneflies look quite similar. Mayflies, however, have claws on the end of each of their legs with a single hook, while stoneflies have claws with two hooks. Of course, you might need a magnifying glass or even a microscope to count the number of hooks on these insects’ tiny claws!
About: Mayflies thrive in standing (lentic) and flowing (lotic) water habitats. As nymphs, they live underneath rocks along the bottoms of streams, ponds, and lakes. There are many mayfly species, which feed in different ways: gathering debris, scraping algae from rocks, and even hunting smaller aquatic creatures. After incomplete metamorphosis (no pupa stage), the winged adults emerge from the water’s surface. They molt their exoskeletons once during adulthood. Adulthood lasts, at most, a few days because adults don’t have mouths and cannot feed.
A mayfly nymph, Drunella grandis, or western green drake.
Stoneflies
Order: Plecoptera
Nymph Identification: Aquatic stonefly nymphs look very similar to mayflies (see above), with distinct heads, thoraxes, and abdomens. Like mayflies, they also have wing pads, three pairs of segmented legs, and two antennae. However, stoneflies will always have just two long, thin tails, and they always have two hooks on the end of each claw.
About: Stonefly nymphs live in clean, flowing (lotic) water like streams and rivers. Nymphs live along the streambeds gathering debris and plant matter as food, or in some cases eating smaller aquatic insects. After their incomplete metamorphosis (no pupa stage), the winged adult stoneflies emerge from the water. Most species reach adulthood and emerge between late winter and early summer.
A stonefly nymph, Pteronarcys californica, or giant salmonfly
Caddisflies
Order: Trichoptera
Larvae Identification: Many aquatic caddisfly larvae are easily recognizable by their distinct cases. These larvae construct tiny cases out of little pieces of plant matter or rock, which they live inside of, with only their heads, thoraxes, and legs exposed. Hidden within the case, the abdomen of the caddisfly is relatively soft and ends in two anal claws instead of tails. There are some species of “free-living” caddisfly larvae that do not make cases. In all caddisfly larvae, the classic head, thorax, and abdomen body sections can seem less easily recognizable compared to mayflies and stoneflies. Caddisflies may have a more maggot-like appearance, especially the free-living caseless ones.
About: Caddisflies live in flowing (lotic) water and sometimes in standing (lentic)water. Caddisfly larvae produce silk. The larvae will use the silk to fasten bits of plant matter or sand together into a case (looks like a shell). Some larvae don’t make shells and instead use silk to tether themselves to streambeds or build tiny nets to catch prey (like a spider’s web). Before adulthood, caddisflies transition through a pupa stage, during a process called complete metamorphosis. Many caddisfly pupae seal themselves in their cases for safety during this stage. The winged adults emerge from the water.
A caddisfly larva in the family Brachyceridae
Dragonflies and Damselflies
Order: Odonata
Nymph Identification: One of the best characteristics for identifying dragonfly and damselfly nymphs is their specialized labium or lower jaw. The labium is designed to extend in front of the body and retract as it grasps prey. Like all insects, members of the family Odonata have a head, thorax, abdomen, and three pairs of segmented legs. You may also notice their wing pads. You can tell damselflies and dragonflies apart by the endings of their abdomens. Damselflies have three long but flat tails on the ends of their abdomens, while dragonflies have no tails, but instead short triangular features, creating a pyramid-like shape on the rear tip of their abdomen.
About: The order Odonata includes dragonflies and damselflies. Nymphs are often found in ponds. Dragonflies are predators of other insects during both the nymph and adult life stages. Dragonflies have a modified labium (lower jaw) that rapidly extends and pulls in prey. After incomplete metamorphosis (no pupa phase), the winged dragonfly adults emerge from the water. Female dragonflies have specialized ovipositors on the tips of their tails, an organ that allows them to dip their tails below the surface of the water to safely lay their eggs in aquatic plants.
A dragonfly nymph, Ophiogomphus severus, or pale snaketail
Fly larvae
Order: Diptera
There are numerous species of aquatic fly larvae. Horseflies, mosquitoes, black flies, and midges are just a few examples. As larvae, flies have an elongated body that looks almost like a segmented worm. They have three pairs of legs, which may be small and hard to see. Aquatic flies undergo complete metamorphosis (i.e., with the pupa stage) before emerging from the water as flying adults.
Water beetles
Order: Coleoptera
There are several families of beetles that live in water during their larval, pupal, and adult stages. Beetle larvae may look somewhat similar to fly larvae, with long and segmented bodies. Adult water beetles will have a rounded, hardened forewing that covers most of their bodies.
Water striders and water scorpions
Order: Hemiptera
Water striders and water scorpions are two common aquatic insects in the order Hemiptera (“true bugs“). Water striders have elongated bodies and thin, widely spread-out legs, which allow them to stay on the surface of the water. Similarly, water scorpions have elongated and sometimes flat bodies. Water scorpions use their front pair of legs to capture prey; the front pair of legs is noticeably bulkier than the other legs.
Looking through a lake sample for aquatic insects.
Study Aquatic Insects & Ecology with Wild Earth Lab
Are you interested in teaching your students about aquatic insects? Check out my complete aquatic macroinvertebrates unit:
Are you interested in reading more posts about animals and insects you can spot in your local area? Subscribe or follow Wild Earth Lab using the links below!
A short bonus post here! After writing two posts about the water cycle (how it works and how humans effect it), I still felt like there was more to write. I owed it to the wonderful mountains where I live, to touch on the important role of mountains in the water cycle. In this mini post, we will cover the rain shadow effect and how mountains impact the water cycle!
Mountains play a key role in the water cycle! Pictured here is Colorado’s Huron Peak, viewed from Lake Ann Pass.
Mountains’ important role in the water cycle
Here in the Rocky Mountains, we are approaching an important time of the year: spring snowmelt! Throughout the winter, snow builds up in the mountains, then when warmer weather comes, it rapidly melts, causing a massive increase in the flows of streams and rivers. The water that starts in the mountains benefits all sorts of downstream users – fish like salmon that travel dozens or even hundreds of miles through rivers, riparian plants like willows and aspen that thrive near streams, and all sorts of animals that need water for drinking or habitat purposes. And of course, people use this water – from mountain towns to coastal cities and anywhere in between! Scientists have aptly described mountains as the water towers of the world. Whether you live near mountains or not, water resources near you are likely impacted by the seasonal cycle of snow building up and melting in mountains.
But why do mountains get so much precipitation, to begin with? The answer relates to the water cycle and temperature. When air comes off of the ocean and starts moving across a continent, it is warm and has lots of water vapor. As that air moves inland and encounters mountains, it must move upwards to pass over the mountains. You may recall from my recent post on the water cycle that as water vapor rises up in the atmosphere it cools and condenses into liquid water droplets. As the tall mountains force air to travel higher, the cooler temperatures at greater elevations cause water vapor to condense and fall as raindrops or snowflakes, depending on the temperature.
The side of the mountain where the air travels up first will receive lots of precipitation. As air moves lower down the opposite side of the mountain, it becomes warmer again. But now, that air has less vapor than before because it lost water as precipitation while traveling over the mountains. The result is warmer, drier air on the inland side of the mountains. This is why we often see lots of precipitation on one side of mountains and arid regions or deserts on the other side. This noticeable difference is called the rain shadow effect.
A massive thunderstorm rolls in over the San Juan mountains, as seen from Snow Mesa. It sure was scary being where I was to take this picture.
In the Rocky Mountains, air generally moves eastward: traveling from the Pacific Ocean and moving east across North America. This is why the western slope of the Rocky Mountains experiences more snow than the Front Range on the east side. However, demand for water is high on the east side of the mountains, where many people live in cities such as Denver and Colorado Springs. To keep up with the demand for water, humans actually move water from the west side to the east side of the Rocky Mountains using man-made ditches high in the mountains, that catch and divert snowmelt from where it would naturally flow. Where humans live doesn’t always match up with where water resources are available. This motivates us to alter the water cycle to meet our needs…
This is part two of a series of posts on the water cycle. In part one, we learned how the water cycle makes life possible for land-dwelling plants and animals, including humans. The water cycle provides the constant source of freshwater that we need to survive. The sun powers the process of evaporation, which separates fresh water vapor from our oceans. This can fall as precipitation on land.
For Teachers: If you’re an educator planning to teach the water cycle, great learning resources are key to deepening understanding! That’s why I create Earth and environmental science units – packed with hands-on learning activities and engaging science diagrams made from my original watercolor artwork. I think you and your students will love my complete Water Cycle Unit(plus you’ll support my blog with your purchase! ❤️)
There is no doubt that the water cycle impacts our lives as humans. Humans, however, impact the water cycle too. Our actions as a species have effects on every step of the water cycle. In this post, let us dive deeper into the ways humans are affecting the water cycle. Although it can be overwhelming to think about the numerous ways that we impact this natural cycle – and I certainly felt a little overwhelmed in doing the research to write this post – my goal here is not to dishearten anyone about water resources. Change starts with education, and ultimately requires effort on both an individual and a larger scale. At the end of this post, I share some simple and inexpensive ways we can save water resources and reduce our impact on the water cycle. I also made a Saving Water Bingogame to help make learning about water resources fun for kids and to encourage simple steps in families’ daily routines to help save water!
Hand-drawn and labeled Water Cycle Diagram, with transpiration, runoff, infiltration, and more!
Glaciers and Ice Sheets
Due to human-caused (“anthropogenic”) climate change, the total amount of water stored in glaciers and semi-permanent snowfields has decreased each year for more than 30 years. This means that every year the amount of new glacial ice forming is less than the amount of glacial ice melting, on average, across the planet.
Glaciers and ice sheets are the largest storage of freshwater on the planet, making up over two-thirds of all the freshwater on Earth! Glacial ice also serves an important role in regulating our planet’s temperature. Compared to water or land, ice is very effective at reflecting solar radiation.Ice’s reflectiveness helps keep the Earth’s temperatures cool. However, as glaciers melt, less radiation is reflected, which causes warming, and consequently more glaciers melt. This sort of amplifying effect is called a positive feedback cycle.
I visited Byron Glacier in Alaska, which is an example of a glacier in retreat – one that shrinks more than it grows each year
Oceans
Saltwater currently makes up about 97.5% of the water on Earth! And this amount is increasing. As glaciers, ice sheets, and semi-permanent snowfields melt, their waters often flow into the oceans, mixing with salt water. The result is sea level rise. This can cause (and already is causing) an upsetting impact on humans that live in low-lying areas near oceans, such as some island nations and coastal communities.
Rising ocean levels also threaten coastal wetlands and estuary ecosystems. These are unique marshy areas along the coast with abundant and diverse plant and animal life. In addition to providing habitat for wildlife, coastal wetlands provide a buffer to coastal communities during weather events like floods. Also, the roots of the many plants in these wetlands help prevent erosion along coasts. Losing these unique coastal ecosystems also means losing their ecosystem services – the benefits that they provide to humans.
The Outer Banks of North Carolina
Precipitation
Climate change doesn’t just impact water in glaciers – it also impacts the water that falls from the sky as precipitation. Changes to the global climate can impact when, where, and how much precipitation falls. It can also impact whether precipitation falls as rain or snow.
16 inches of snow on the Colorado Front Range, March 2021. Even though I don’t love shoveling snow, I am grateful for big snowstorms – snow melt in the spring provides an important water resource in Colorado!
Runoff
A lot of the water we use comes from diverted runoff – meaning we change the path that water takes back to the ocean so that it goes where we need it most. This can happen on a very small scale, such as diverting the water that runs off of our roofs into a rain barrel. Or on a very large scale – like the Grand Ditch in Colorado, which takes water from the west side of the Rocky Mountains and brings it to the Front Range, on the opposite side of the continental divide.
Runoff begins high in the mountains where snowmelt and rain on mountain peaks feed the headwaters of streams. Runoff ends when water flows into the oceans at estuaries and deltas. As humans, we have impacts on the runoff process from the mountains to the oceans, and everywhere in between. Warmer winter temperatures in the mountains due to climate change may cause less winter snowpack than mountain regions experienced historically. Less winter snowpack means less springtime runoff.
Building reservoirs is one of the most noticeable impacts that humans have on the runoff process. Reservoirs are necessary for mountain and arid regions to maintain a year-round water supply. In these areas, most of the runoff each year arrives in a fairly short time frame in the spring, as the snow melts in the mountains. Agriculture in these areas would not be possible without storing some of that runoff to use later during the summer and fall growing seasons. Reservoirs are the way we stop and keep that water. Reservoirs have great benefits to our ability to live in arid regions but have some downsides too. Storing water in a reservoir in an arid region means having that water open to the atmosphere. Consequently, over several months of storage, significant amounts of reservoir water are lost to evaporation.
Downstream of reservoirs, the discharge, or volume of water running through a river, will be less than normal. Downstreamaquatic ecosystems can be harmed by lower flows in rivers and streams. Changing a swift, snowmelt-fed river to a slow, reservoir outflow can impact the water quality and water temperature. Some fish species are adapted for life in cold, fast-flowing water, so changes in their home stream habitat can cause them harm.
My rain barrel diverts runoff from my roof, which I then use to water my garden.
Infiltration
As water travels across the earth’s surface, naturally some of it seeps into the tiny pore spaces of the underground rocks and sediments, in a process called infiltration. In cities, large areas of the ground are covered in pavement, which is less permeablethan soils – it does not allow water to pass through as easily. This prevents infiltration from occurring in these areas. Consequently, flooding may occur because there is no place for the water to go, so it stays on the surface. Water may also become contaminated as it flows across paved surfaces, carrying pollution into nearby lakes and streams.
Groundwater
Groundwater provides much of the water we use in our homes, for irrigating crops, and for livestock drinking water. We get groundwater out of aquifers, which are underground geologic units containing water in their pore spaces. To extract the water from an aquifer to the surface, we install wells that are pumped. Pumping can have many impacts on the water cycle’s groundwater movement and storage. In some cases, pumping will lead to lowering the water table and depleting aquifers – in other words, taking groundwater out of aquifers faster than water can infiltrate into aquifers. Because this type of use will eventually lead to a groundwater well running dry, it is unsustainable water use.
Ideally, groundwater is pumped at slower, more sustainable rates, allowing time for aquifers to replenish and refill with water. Even so, pumping can have impacts on the water cycle. Any amount of pumping can change the way that water flows underground, impacting the amount of water that feeds springs and gaining streams. This can have both ecological impacts and impacts on downstream human water users.
A groundwater monitoring well extends tens of feet below the ground and allows scientists to track changes in the water table at a location of interest
Transpiration
Transpiration is the process of plants taking up liquid water through their roots and releasing water vapor through their leaves. Transpiration is an important part of the water cycle, moving water from the soil to the atmosphere. Humans tend to change the natural plant communities of an area – whether by replacing plants with buildings and pavement, by removing natural plant communities to grow food crops, or by introducing invasive plant species. A change in the plant community will change the amount of transpiration.
It is difficult to imagine that transpiration has much of an impact on the water cycle because it is a process that we cannot see – water vapor is invisible to us. However, a single tree can transpire thousands of gallons of water each year. Furthermore, the amount of water used by different plants varies significantly. Growing a high-water-use crop in an arid region can deplete the local water resources of an entire area! One recent example of this is in Harney County, Oregon, USA, where hay farming is a main industry, despite the difficulties of growing this high-water-use crop in a naturally dry environment. Since the region’s precipitation does not provide enough water for hay to grow, groundwater is pumped to irrigate the hay fields at a rate the aquifer cannot sustain. (See further reading and references at the bottom of this article to read more about Harney County’s water resources).
From tiny wildflowers to towering trees, all plants must transpire water to perform photosynthesis!
Everyone needs clean, fresh water every day – to drink, clean with, and grow food. Clean water is a human right, but something that not everyone has access to. If you do have access to plentiful, clean water, you have the great opportunity to start considering some ways to use less water and lessen your impact on the water cycle. There are many creative ways to reduce water use while still having enough water for our basic needs. Small actions are the first steps towards lessening our impacts on the water cycle and conserving water resources.
Time your shower, then commit to decreasing your shower time by two minutes.
Reuse drinking glasses to decrease the number of dishes to be washed.
If emptying a water bottle, consider dumping the water out on a houseplant, using it to soak dishes, etc.
Research your food – find out how much water it takes to grow the different plant and animal foods that you eat.
Inspect your home’s faucets and hoses for leaks.
Consider areas of your yard where you do not really need grass, like the margins next to sidewalks – even replacing a small area with low-water-use plants, gravel, or wood chips can help decrease water usage in the yard. Yard improvement projects can also be done in a way that improves your backyard’s wildlife habitat.
Turn off the tap while scrubbing dishes.
Turn off the tap while brushing your teeth.
Consider flushing the toilet every other time (for #1s only).
Talk to your family and friends about the importance of using less water!.
Free Printable Learning Resources for the Water Cycle
My free resources page includes several water and water-cycle related free printable learning resources, including a Saving Water Bingo game, my hand-drawn Water Cycle Diagram, and a Freshwater Visualization activity. My email newsletter subscribers can access my full collection of free resources.
Find this game on the free resources page.
Find this diagram on the free resources page.
Try this freshwater visualization activity from my free resources page.
Are you a teacher, homeschool parent, or other educator? If you liked this post on the water cycle, then I think you will enjoy using these water-related learning materials with your students: